Model Building for Prediction

Last’s Weeks on Steroids

Fernando Rios-Avila

Levy Economics Institute

November 14, 2024

Motivation

  • You want to predict apartment rental prices using location, size, amenities, and other features. But with so many variables available,
    • how should you specify the candidate models?
    • Which variables should they include, in what functional forms, and with what interactions?
    • How can you make sure the candidates include truly effective predictive models?
  • You want to predict hourly sales for a new shop, based on data from a similar existing shop.
    • How should you define your y variable, and how should you select predictor variables for regression models to find the best fit?
    • Finally, how can you evaluate the prediction in a way that informs decision-makers about the uncertainty of your prediction?

What is old? whats the new?

  • We have learned about the basics of prediction.

    • We need to worry about the out-of-sample prediction error. Not the in-sample error.
  • We know we can use cross-validation to select the best model.

  • And we know we can construct the best model by hand, because we have domain knowledge.

But what if we have a lot of variables? What if we have a lot of data?

As \(K\) grows large \(KxK\) grows larger

  • 1 variable, 1 model
  • 2 variables, 3 models
  • 3 variables, 7 models
  • 10 variables, 1023 models!
  • 20 variables, 1,048,575 models!

Prediction process: key steps

  • Start with defining your “question” - what you want to predict.
  • Based on the question, the target variable is defined (operationalize in the data).
    • Followed by defining the sample to be used (as the target)
    • Determine the target variable and functional form (label engineering)
  • Define the list of predictors (feature engineering)
    • Build the model(s)
    • evaluate the model
    • make the prediction

Sample design

  • In a prediction exercise, we are interested in predicting target for units that look those in the live data.
    • Select a sample that is representative of the live/target data.
  • But, there is a trade-off:
    • Keep observations close to what we’ll have in live data,
    • Or aim for a large sample size.
  • Sample design is eventually a compromise

Sample design: filtering

  • Before settling on a model, we need to design the sample.
  • Filtering our data to match the business/ policy question.
  • It may involve dropping observations based on key predictor values.
    • We would be looking for 3-4 star hotels, not all of them.

Sample design: Spotting errors

  • For prediction exercise, we should spend more time on finding and deleting errors.
    • We have no chance predicting extreme values, and certainly not errors.
    • They provide no information, and they may distort the model.
  • Keeping an extreme value that is likely to be an error, will have a high cost - the quadratic errors in the loss function will tilt the curve and our prediction will be off for most observations.
    • OLS is very sensitive to outliers.
  • Stronger focus on dropping observations we think are errors.
  • If data is missing, You may either drop the observation or try to understand why it is missing, and use that in the prediction.

Case study of used cars: Sample design

  • Dropping hybrid cars, manual gear, truck
  • Drop cars without a clean title (i.e., cars that had to be removed from registration due to a major accident)
  • Drop when suspect cars with clearly erroneous data on miles run,
  • Drop cars in a fair (=bad) condition, cars that are new
  • Data cleaning resulted in 281 observations ( I kept Fair and new)

Label engineering - defining target

  • We need to define what will our target variable be.
  • In some cases, this requires no action, the business question may define it:
    • the price of the hotel is one such case.
  • Often it requires thinking and decision-making about definition.
    • How to define default, injury, purchase
      • Binary vs continuous.
      • Log vs level

Label engineering - log vs level

  • When price is the target variable, its relation to predictor variables is often closer to linear when expressed in log price.
  • Log differences approximate relative, or percentage, differences, and relative price differences are often more stable.
  • The related technical advantage is that the distribution of log prices is often close to normal, which makes linear regressions give better approximation to average differences.
    • Also, Log() is not the only transformation that can be used.
  • Choosing the right functional form is important but not always easy.
    • Econometrics vs prediction mindset

Label engineering - log vs level

  • When the target variable is expressed in log terms, we want to predict the value of the target variable (\(\hat y\)) not its \(log(y)\).
  • Simply doing this \(e^{\log y}\) is not the same as obtaining \(\hat y\).

Technical details:

\(\hat{y}_j = e^{ \widehat{\log y}_j + \hat e_j}\)

  • But, because \(\hat e_j\) is not observed, we need to approximate it via “Some” method.
    • If we assume that the error term is normally distributed: \[\hat{y}_j = e^{\widehat{\ln y}_j} e^{\hat{\sigma}^2/2}\]

Used cars case study: Label engineering - log?

  • Business case is about price itself, continuous
  • But model can have level or log price as target
  • Look at some patterns
  • Compare model performance
  • Log vs level model - some coefficients easier interpreted
  • When we have two cars of same age and type; the one with 10% more miles in the odometer is predicted to be sold for 0.5% less.
  • SE version is 1300 dollar more costly.

Used cars case study: Label engineering - log?

Model Point prediction 80% PI: upper bound 80% PI: lower bound
in logs 8.63 8.18 9.08
Recalculated to level 5,932 3,783 9,301
In levels 6,073 4,317 7,829

Asymetric for Log-model, Symetric for Linear Model

Pick what works better

Feature engineering

  • Requires the most effort
  • Feature engineering - defining the list and functional form of variables we will consider as predictor.
  • Importantly, we use both domain knowledge - information about the actual market, product or the society - and statistics to make decisions.

Feature engineering - checklist

  1. What to do with missing values
  2. Dealing with ordered categorical values - continuous or set of binaries
  3. How to use text to create variables (Identify key words)
  4. Selecting functional form
  5. Thinking interactions

What to do with missing values

  • Missing at random: Observations with missing variables are not systematically different from rest, may replace with sample mean and add binary flag.
  • Missing systematically, by nonrandom selection: Must analyze reasons, may simply mean =0, look at the source of the data / questionnaire.
  • If very few missing and it is random, do not do anything.
  • Few cases, you may want to impute or look for proxies.

What to do with different type of variables

  • Binary (e.g, yes/no; male/female; 1/2) – create a 0/1 binary variable
  • String / factor – check values, and create a set of binaries.
  • Continuous – nothing to do. Make sure it is stored as number. Perhaps Winsorize.
  • Text – Natural Language Processing. Mining the text to get useful info.
    • Counting words, looking for key words, etc.

Case study: Predicting Airbnb Apartment Prices

  • London,UK
  • http://insideairbnb.com
  • 50K observations
  • 94 variables, including many binaries for location and amenities
  • Key variables: size, type, location, amenities
  • Quantitative target: - price (in USD)
  • In reality: GBP

Case study: Predicting Airbnb Apartment Prices

  • Key issue is to look at variables and think functional form
  • Guests to accommodate goes up to 16, but most apartments accommodate 1 through 7. Keep as is. Add variables for type. No need for complicated models
  • Regarding other predictors, we have several binary variables, which we kept as they were: type of bed, type of property (apartment, house, room), cancellation policy.
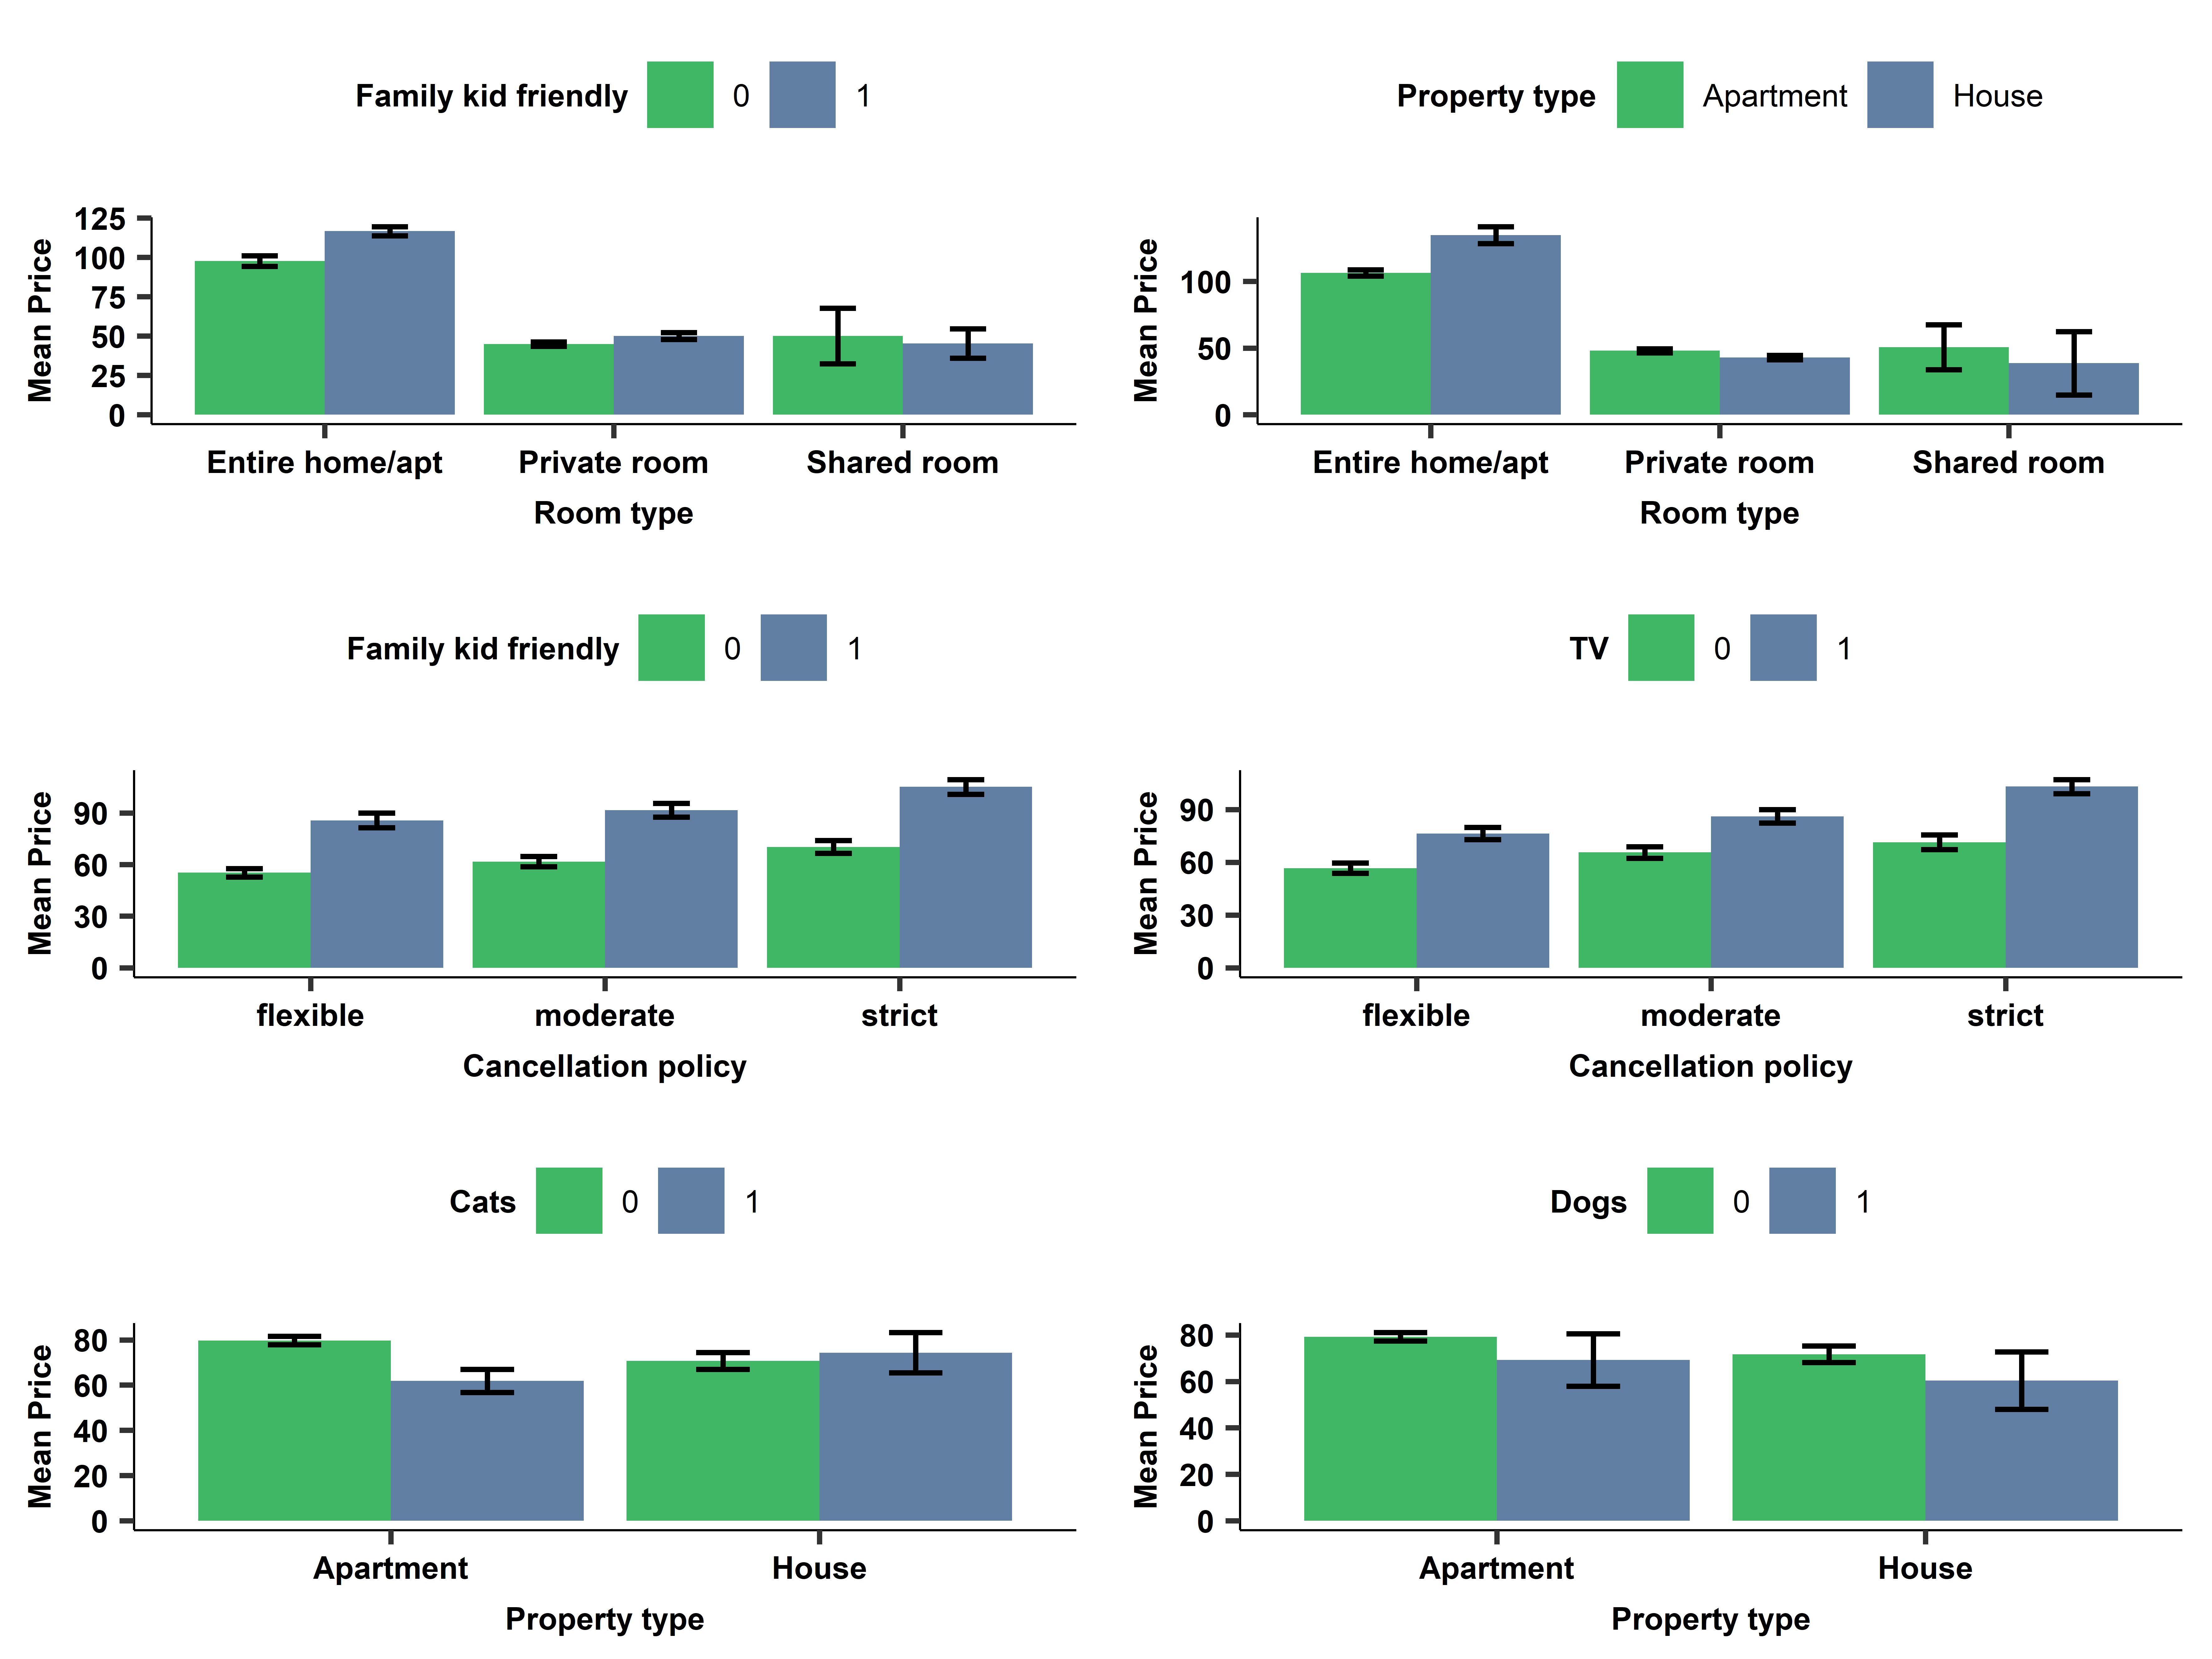
  • Look at possible need for interactions by domain knowledge / visualization

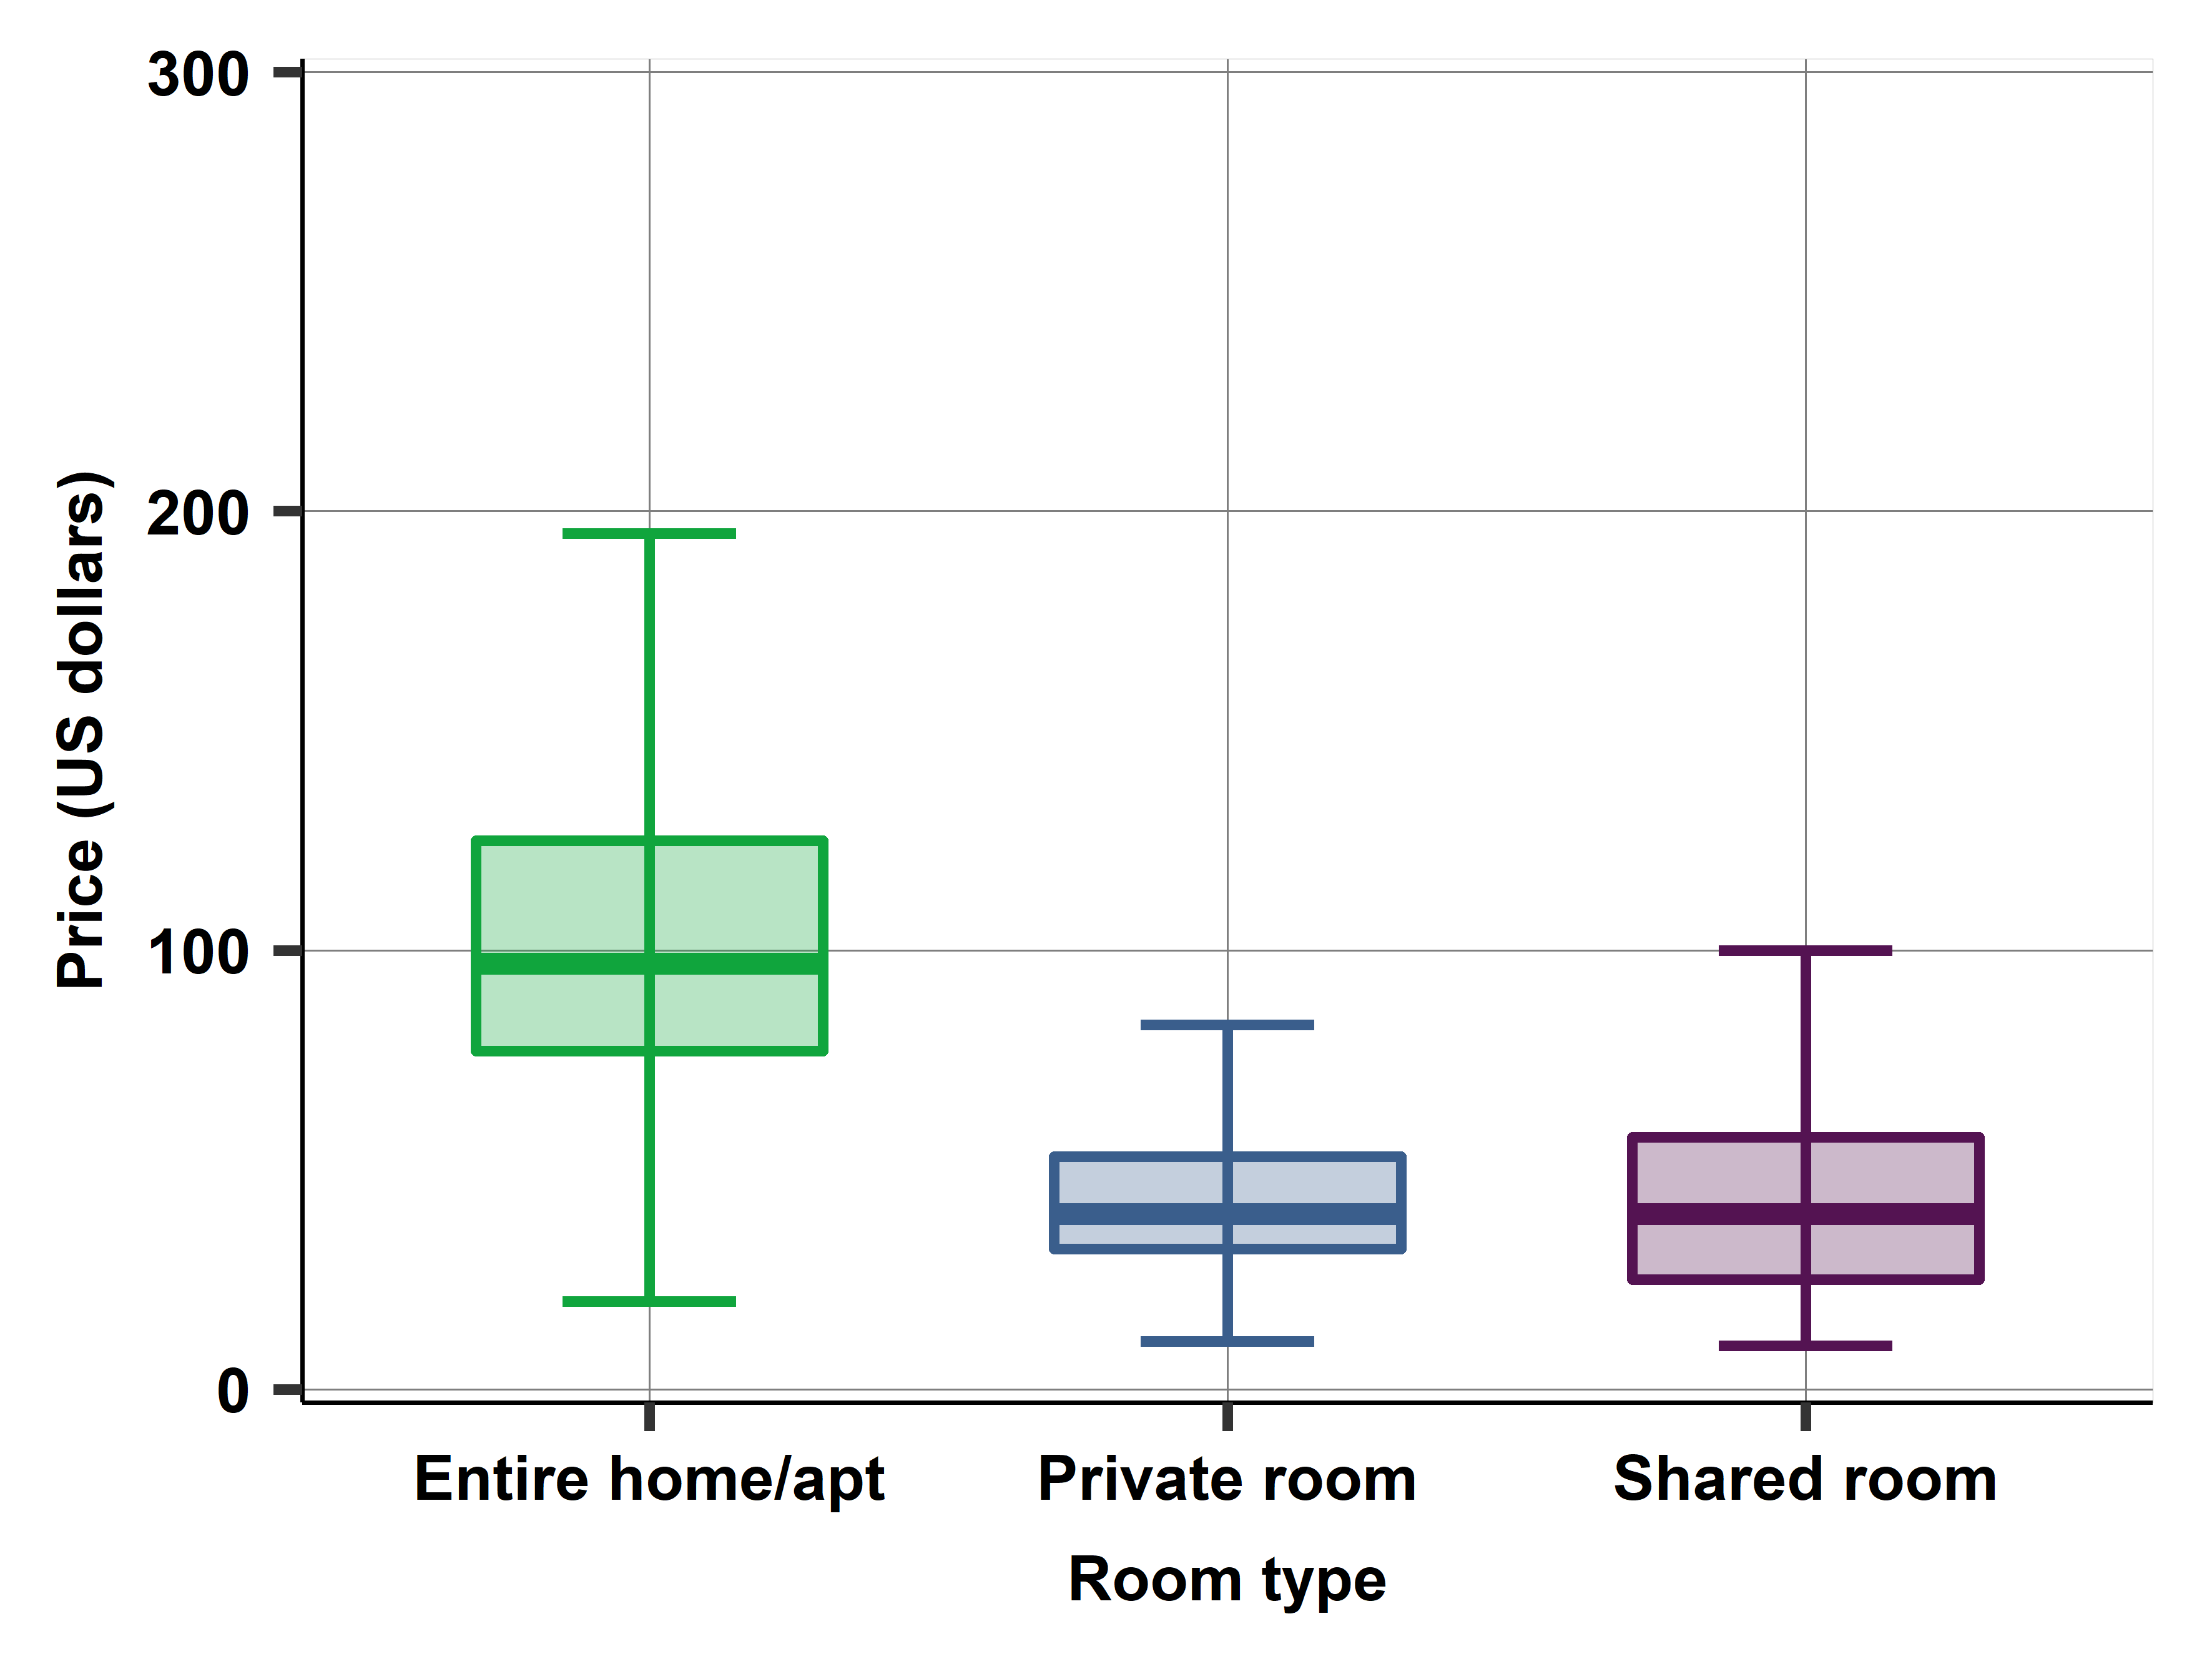
Graphical way of finding relationships

Graphical way of finding interactions

Trying all models?

Model building

Two methods to build models:

  • by hand - mix domain knowledge and statistics
  • by smart algorithms = machine learning

Model building and selection: Build model by hand

  • Use domain knowledge drives picking key variables
  • Drop garbage - drop variables those that are useless. May be because of poor coverage or quality, or they may be irrelevant.
  • Look at a pairwise correlations. Multi-collinearity is an issue for smaller datasets
  • Prefer variables that are easier to update - cheaper operation of a prediction model used in production
  • Matters when you have relatively many variables compared to size of observations

Selecting Variables in Regressions by LASSO

  • Key question: which features to enter into model, how to select?
    • By hand – domain knowledge. Advantage: interpretation, external validity
    • Disadvantage: with many features it’s very hard. Esp. with many possible interactions!
  • There is room for an automatic selection process.
  • Some are computationally very intensive (compare every option?)
  • Advantage: no need to use outside info
  • Disadvantage: may be sensitive to overfitting, hard to interpret

LASSO idea

  • LASSO (the acronym of Least Absolute Shrinkage and Selection Operator) is a method to select variables to include in a linear regression to produce good predictions and avoid overfitting.
  • LASSO is a shrinkage method: it shrinks coefficients towards zero to reduce variance
    • Cost is in bias - LASSO is not unbiased
    • Unlike OLS
  • LASSO is a feature selection method as well

LASSO process

  • It starts with a large set of potential predictor variables that, typically, include many interactions, polynomials for nonlinear patterns, etc.
  • LASSO modifies the way regression coefficients are estimated by adding a penalty term for too many coefficients.
  • The way its penalty works makes LASSO assign zero coefficients to variables whose inclusion does not improve the fit of the regression much.
  • Assigning zero coefficients to some variables means not including them in the regression.

Side note: LASSO vs BIC

  • The purpose is similar to the adjusted in-sample measures of fit, such as the BIC.
  • To find a regression that balances fitting the data and the number of variables.
  • But its result is different:
    • instead of producing a better measure of fit to help find the best one
    • it alters coefficients to produce a better regression directly.

LASSO

Consider the linear regression with i=1…n observations and k variables, denoted 1…k:

\[y^E = \beta_0 + \sum_{j=1}^k \beta_jx_j\]

Coefficients are estimated by OLS: which minimizes the sum of squared residuals:

\[\min_\beta \sum_{i=1}^N (y_i - (\beta_0 + \sum_{j=1}^k \beta_jx_{ij}))^2\]

LASSO modifies this minimization by a penalty term:

\[\min_\beta \sum_{i=1}^N (y_i - (\beta_0 + \sum_{j=1}^k \beta_jx_{ij}))^2 + \lambda \sum_{j=1}^k |\beta_j|\]

LASSO: how it works

  • \(\lambda\) — tuning parameter.
  • weight for penalty term vs OLS fit –> Strength of the variable selection
  • Main effect of this constraint is to force many coefficients to zero.
  • Best way to keep the sum of the absolute value of the coefficients low while maximizing fit –> zero coefficients on variables whose inclusion improves fit only a little.
  • This adjustment gets rid of the weakest predictors.

LASSO: how it works

  • The value of the tuning parameter \(\lambda\) drives the strength of this selection.
  • Larger \(\lambda\) values lead to more aggressive selection and thus fewer variables left in the regression.
  • But how can one specify a \(\lambda\) value that leads to the best prediction?
  • We don’t need, the algorithm does
  • The LASSO algorithm can numerically solve for coefficients and the \(\lambda\) parameter at once.
  • This makes it fast.
  • Unlike OLS, we have no closed form solutions.

Other shrinkage methods

  • So LASSO is a shrinkage method: it shrinks coefficients towards zero to reduce variance
  • There are other ways, other functional forms
  • Ridge regression has a quadratic penalty:

\[\min_\beta \sum_{i=1}^N (y_i - (\beta_0 + \sum_{j=1}^k \beta_jx_{ij}))^2 + \lambda \sum_{j=1}^k \beta_j^2\]

  • No coefficient is shrunk to zero. But close…

Lasso and Ridge

  • Lasso, Ridge regressions called regularization
  • LASSO is “L1”, Ridge is “L2”
  • Both may help reduce overfitting
  • LASSO also acts as feature selection model
  • Elastic net helps find a parameter between \(|\beta_j|\) and \(\beta_j^2\) via cross validation

Airbnb Pricing Model building

  • Process: build many models that differ in terms of features:
    • Which predictors are included
    • Functional form of predictors
  • Here: specified eight linear regression models for predicting price.
  • Data has 4393 observations. This is our original data.
  • 80% is our work set (3515 observations), the rest we will use for diagnostics.

Versions of the Airbnb apartment price prediction models

Mod Predictor variables N var N coeff
M1 guests accommodated, linearly 1 2
M2 = M1 + N beds, N days review, type: property, room, bed type 6 8
M3 = M2 + bathroom, cancellation, review score, N reviews (3 cat)+ F(miss) 11 15
M4 = M3 + N guest squared, square+cubic for days since 1st review 11 17
M5 = M4 + room type + N reviews interacted with property type 11 22
M6 =M5 + air conditioning, pets allowed - interacted with property type 13 28
M7 =M6 + all other amenities 70 72
M8 =M7 + all other amenities interacted with property type + bed type 70 293

Comparing model fit measures

Model N predictors R-squared BIC Training RMSE Test RMSE
(1) 1 0.40 36042 40.48 40.16
(2) 7 0.48 35598 37.73 37.38
(3) 14 0.51 35478 36.78 36.51
(4) 16 0.57 24076 31.95 32.24
(5) 21 0.57 24096 31.82 32.18
(6) 27 0.58 24113 31.60 32.19
(7) 71 0.61 24281 30.42 31.77
(8) 293 0.66 25675 28.04 51.41

Training and test set RMSE for eight models

  • Training RMSE falls with complexity
  • Test RMSE falls then rises
  • We pick Model M7 based on lowest CV RMSE.

The LASSO model

  • Start with M8 and appr 300 candidate variables in the regression.
  • We ran the LASSO algorithm with 5-fold cross-validation for selecting the optimal value for λ.
  • LASSO regression just marginally better but: LASSO is automatic, a great advantage.
  • Here: domain knowledge helped create M7. In other cases, LASSO could be great.

Post prediction analysis, diagnostics

Evaluating the Prediction Using a Holdout Set

  • Model selection: selecting the best model using cross-validation
  • Once we have picked the best model, we advised going back and using the entire original data for the final estimate and to make a prediction.
  • What part of the data should we use to evaluate that final prediction?
  • The solution is a random split before we do the analysis.
  • Work set: We do all of the work using one part of the data: model building, selecting the best model and then making the prediction itself.
  • Holdout set: another part of the data for evaluating the prediction itself. Don’t touch till the end.

The holdout set

  • To do diagnostics and give a good estimate of how the model may work in the live data
    • Additional twist to the process
    • The holdout set.
  • Holdout set is set is not used in any way for modelling – taken out in the beginning
    • This avoids cross-contamination
  • Used to give best guess for performance in live data
  • Used to do diagnostics of our model

Post-prediction diagnostics

  • Post-prediction diagnostics - understand better how our model works
  • We look at prediction interval to learn about what precision we may expect to see of the estimates.
  • We look at how the model work for different classes of observations
  • such as young and old cars.

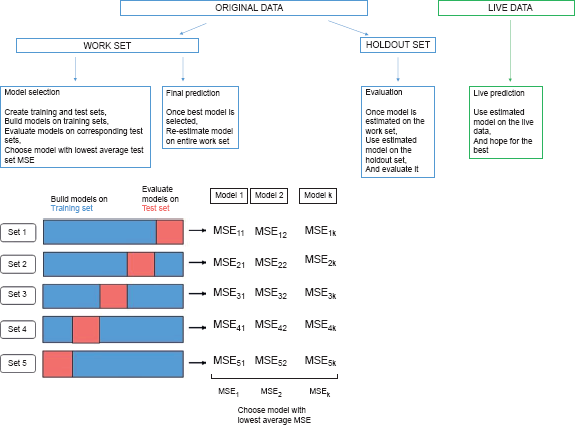
Cross-validation and holdout set procedure

  1. Starting with the original data, split it into a larger work set and a smaller holdout set.
  2. Further split the work set into training sets and test sets for k-fold cross-validation.
  3. Build models and select the best model using that training-test split.
  4. Re-estimate the best model using all observations in the work set.
  5. Take the estimated best model and apply it to the holdout set.
  6. Evaluate the prediction using the holdout set.

Illustration of the uses of the original data and the live data

Post-prediction diagnostics

  • Post-prediction diagnostics - understand better how our model works
  • We look at prediction interval to learn about what precision we may expect to see of the estimates.
  • We look at how the model work for different classes of observations
  • such as young and old cars.

Data work and holdout

  • Data has 4393 observations. This is our original data.
  • random 20% holdout set with 878 observations.
  • The remaining 80% is our work set (3515 observations).
  • Work set will be used for cross-validation with several folds of training and test sets.

Diagnostics

  • Chose the OLS estimated M7.
  • What can we say about model performance?
  • After estimating the model on all observations in the work sample, we calculated its RMSE in the holdout sample. The RMSE for M7 is 41
  • Higher than CV RMSE, could be other way around.
  • Look at diagnostics on the holdout set.

Diagnostics: prices

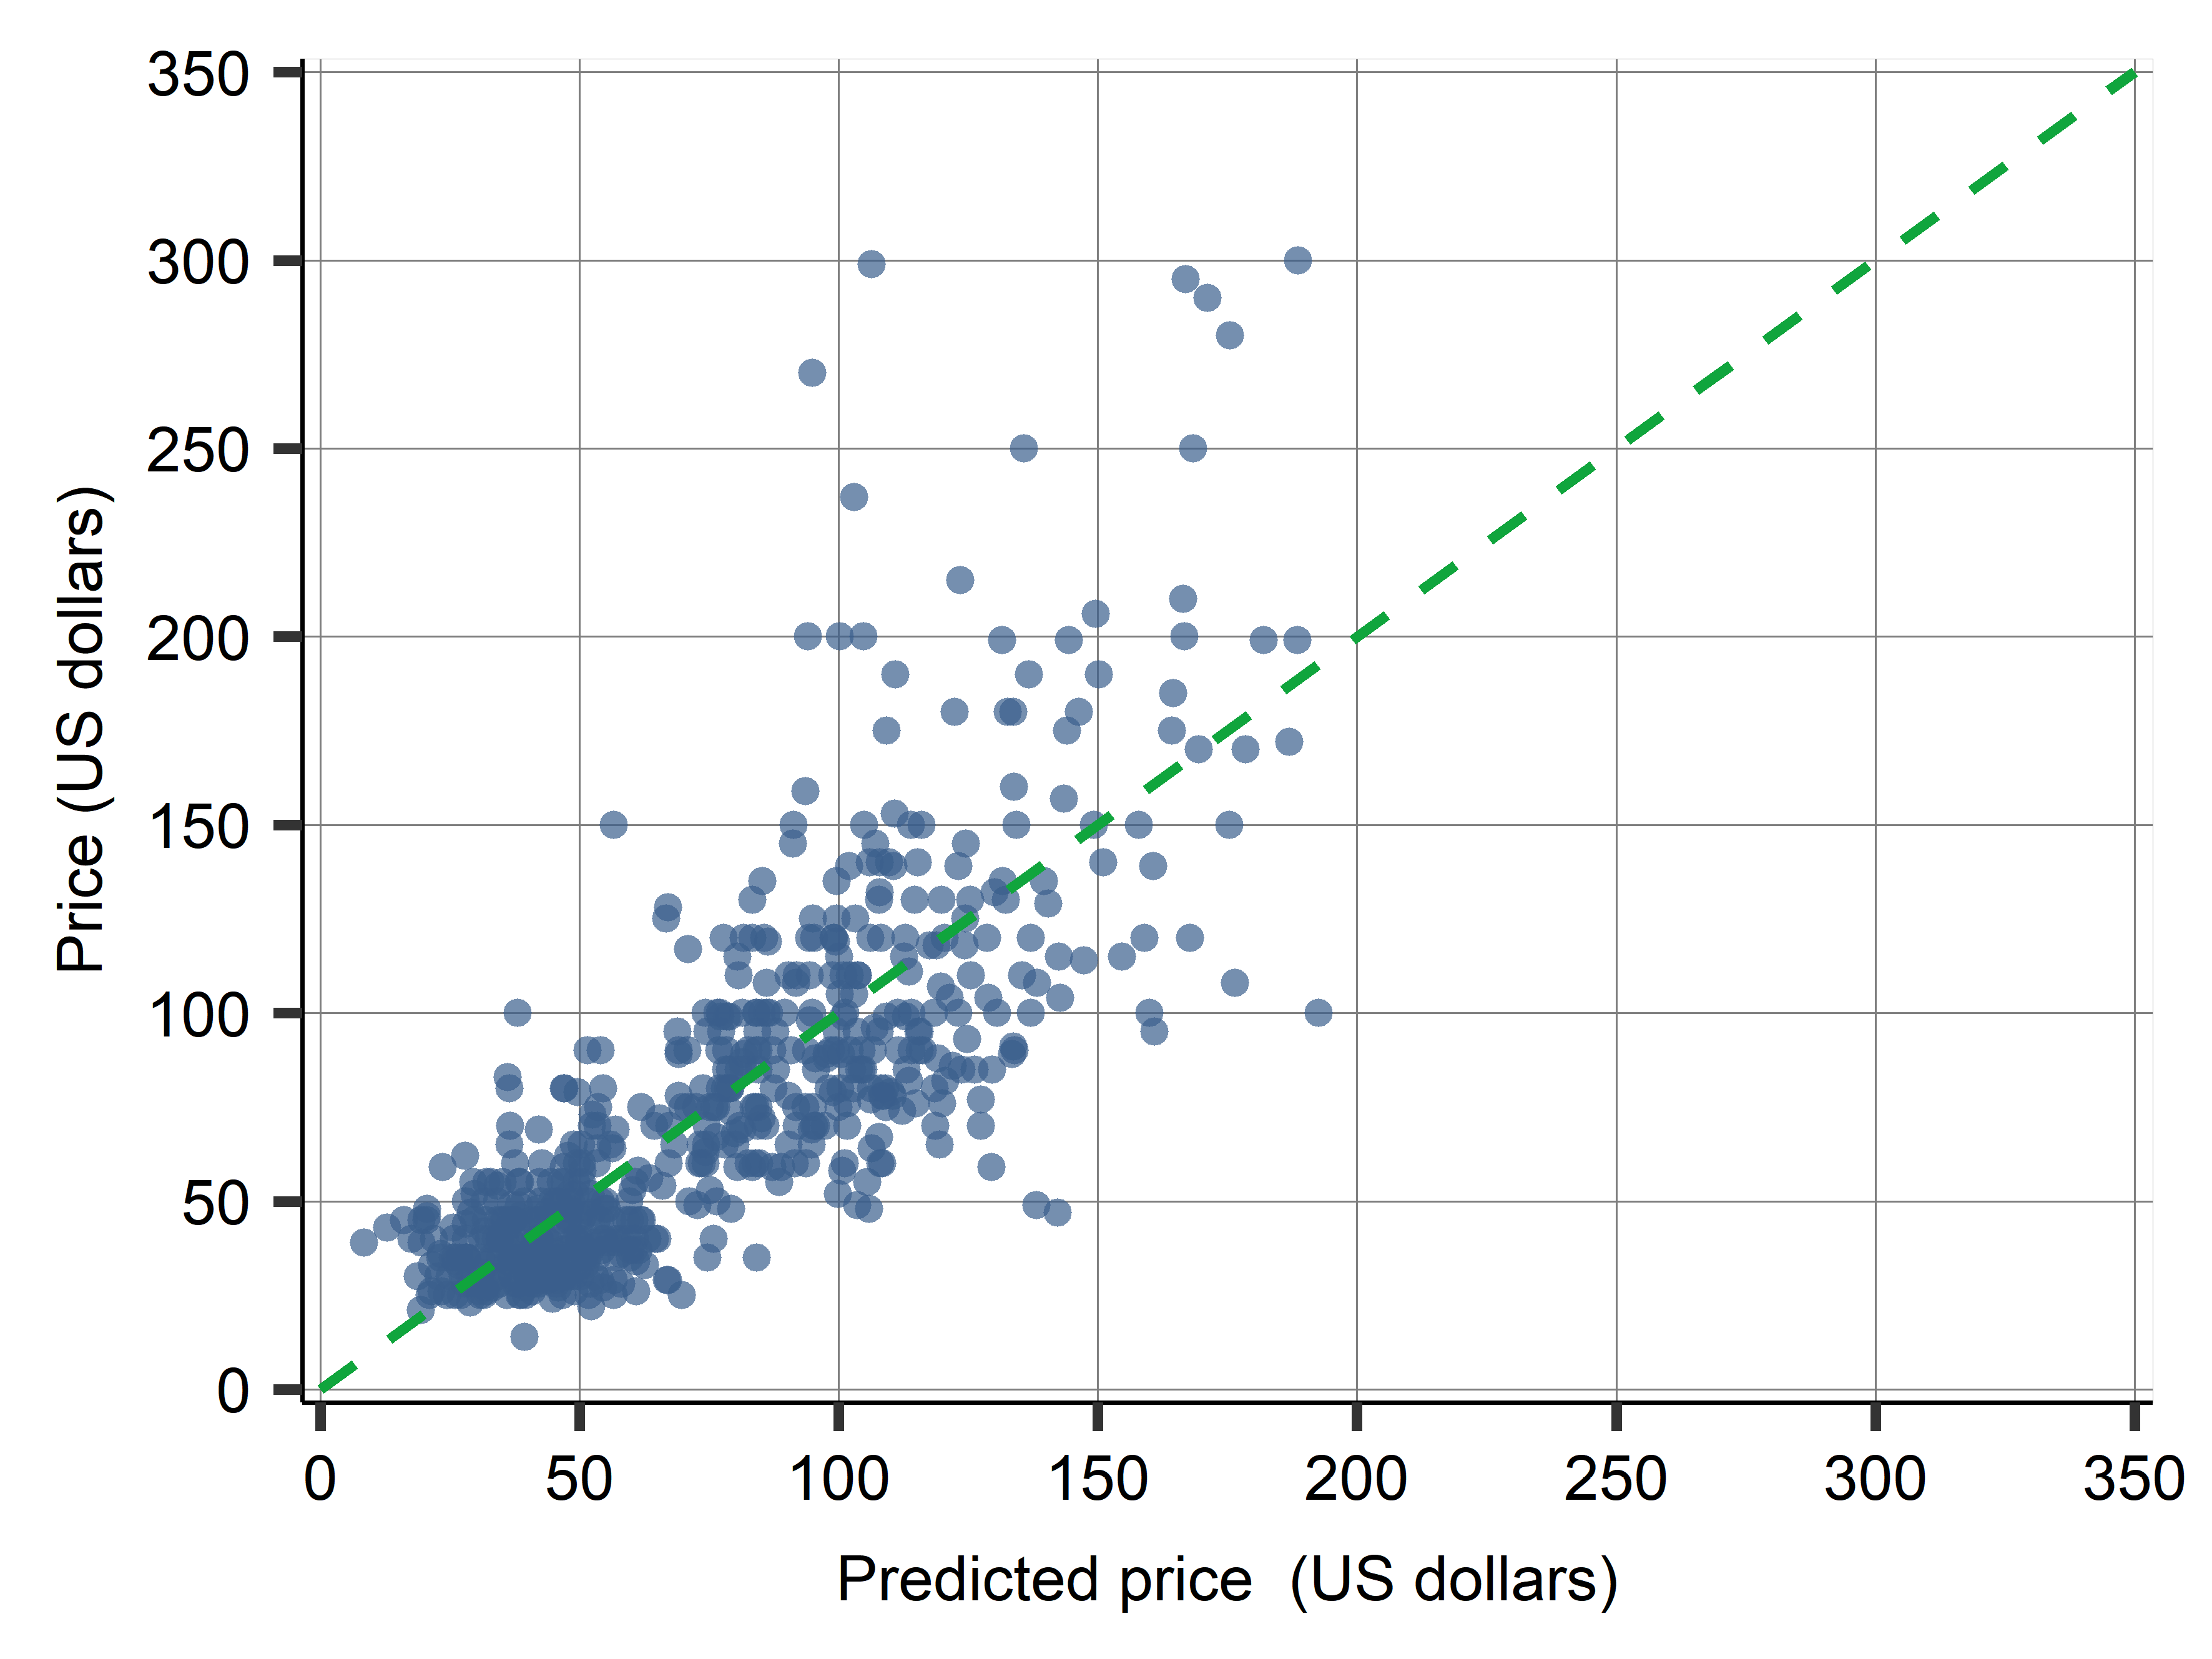
  • y-y-hat plot
  • higher values not really caught.

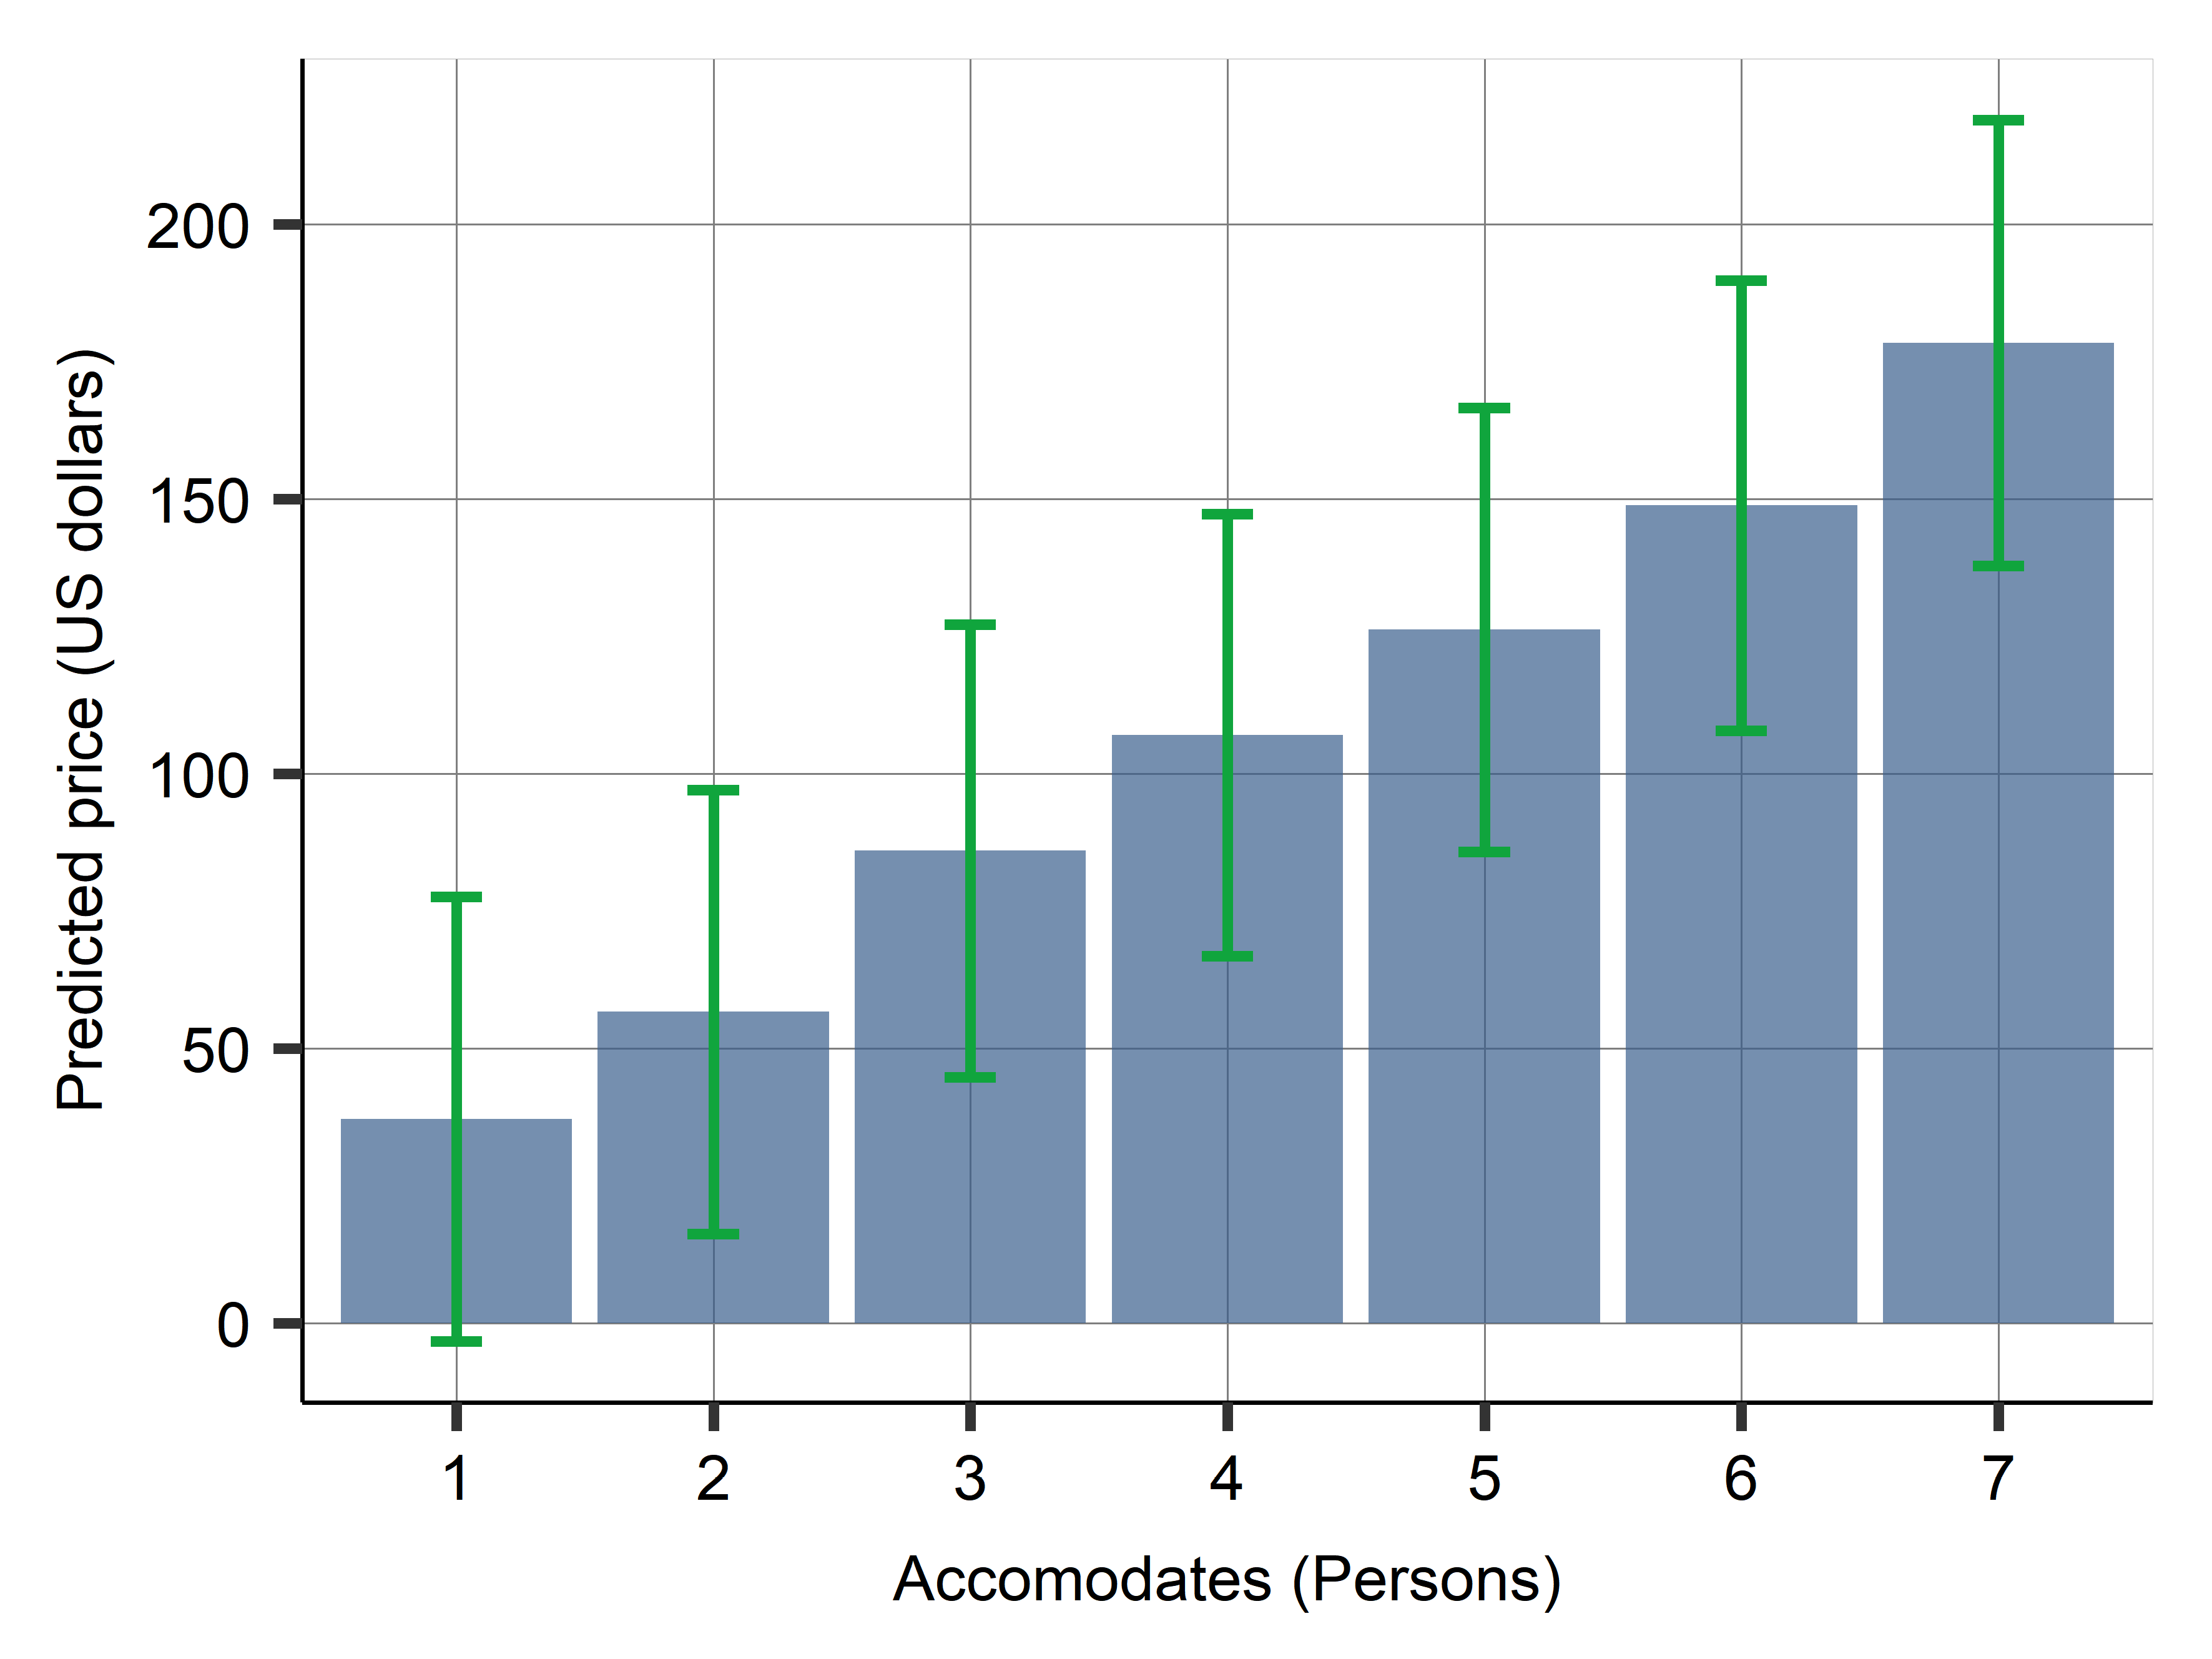
Diagnostics: variation by size

  • The model generates a very wide 80% PI for average apartment
  • bar plot with PI bands
  • wide intervals
  • linear and thus, hurts small numbers more

Prediction with Big Data

  • The principles of prediction are the same with Big Data as with moderate-sized data
  • Big Data leads to smaller estimation error.
  • This reduction makes the total prediction error smaller
  • The magnitude of irreducible error, and problems with external validity, remain the same with Big Data

Prediction with Big Data

  • Another upside is that large number of rows sometimes comes with large number of variables
  • Room for more complex models
  • Consideration: computing power (But there is AWS and Cloud Computing)
  • When N is too large, we can take a random sample and select the best model with the help of usual cross-validation using that random sample

Summary

  • Our aim was to build a prediction model for pricing apartments
  • We built a model, M7, with domain knowledge, and a horse race between models of various complexity
  • Picked the winner by cross-validated RMSE
  • The model is useful for predication, but there is a great deal of uncertainty as suggested by diagnostics (on the holdout set)

Think external validity

  • Future dataset will look different
  • Think about how much
  • Really matters in prediction
  • If uncertain, pick simpler model

Main takeaways

  • We can never evaluate all possible models to find the best one
  • Model building is important to specify models that are likely among the best
  • LASSO is an algorithm that can help in model building, by selecting the x variables and their functional forms
  • Exploratory data analysis and domain knowledge remain important alongside powerful algorithms, for assessing and improving the external validity of predictions

Stata Corner

Stata: LASSO

  • Lasso is one of the few machine learning algorithms that is available in Stata.
    • Stata also has a feature for elastic net and Ridge.
    • for now just focus on LASSO. help lasso
  • The syntax
 lasso model depvar [(alwaysvars)] othervars [if] [in] [weight] [, options]
  • It has various selection options (selection()) but we can use the default.

Stata: LASSO

webuse cattaneo2, clear
lasso linear bweight c.mage##c.mage c.fage##c.fage c.mage#c.fage c.fedu##c.medu ///
    i.(mmarried mhisp fhisp foreign alcohol msmoke fbaby prenatal1), nolog
ereturn display
(Excerpt from Cattaneo (2010) Journal of Econometrics 155: 138–154)

Lasso linear model                          No. of obs        =      4,642
                                            No. of covariates =         26
Selection: Cross-validation                 No. of CV folds   =         10

--------------------------------------------------------------------------
         |                                No. of      Out-of-      CV mean
         |                               nonzero       sample   prediction
      ID |     Description      lambda     coef.    R-squared        error
---------+----------------------------------------------------------------
       1 |    first lambda    107.1305         0       0.0001     334929.8
      37 |   lambda before    3.761556        10       0.0561     316156.2
    * 38 | selected lambda     3.42739        11       0.0561     316154.9
      39 |    lambda after     3.12291        11       0.0561     316156.8
      65 |     last lambda    .2780062        19       0.0550     316532.1
--------------------------------------------------------------------------
* lambda selected by cross-validation.
------------------------------------------------------------------------------
     bweight | Coefficient
-------------+----------------------------------------------------------------
        mage |   .0026703
             |
      c.fedu#|
      c.medu |   .3136748
             |
    mmarried |
Not married  |  -140.4633
     0.mhisp |  -34.00255
   0.foreign |   63.71057
   0.alcohol |   40.29426
             |
      msmoke |
    0 daily  |   167.9734
 6–10 daily  |  -36.54529
  11+ daily  |   -78.1332
             |
       fbaby |
         No  |   51.02337
             |
   prenatal1 |
         No  |  -42.31267
       _cons |   3137.903
------------------------------------------------------------------------------
Stata: LASSO

qui: ssc install elasticregress
webuse cattaneo2, clear
lassoregress bweight c.mage##c.mage c.fage##c.fage c.mage#c.fage c.fedu##c.medu ///
    i.(mmarried mhisp fhisp foreign alcohol msmoke fbaby prenatal1), 
ereturn display
(Excerpt from Cattaneo (2010) Journal of Econometrics 155: 138–154)

LASSO regression                       Number of observations     =      4,642
                                       R-squared                  =     0.0597
                                       alpha                      =     1.0000
                                       lambda                     =     2.7733
                                       Cross-validation MSE       =  3.165e+05
                                       Number of folds            =         10
                                       Number of lambda tested    =        100
------------------------------------------------------------------------------
     bweight | Coefficient
-------------+----------------------------------------------------------------
        mage |          0
             |
      c.mage#|
      c.mage |          0
             |
        fage |          0
             |
      c.fage#|
      c.fage |          0
             |
      c.mage#|
      c.fage |          0
             |
        fedu |          0
        medu |   .5584781
             |
      c.fedu#|
      c.medu |   .3520153
             |
    mmarried |
Not married  |          0  (empty)
    Married  |   151.3538
             |
       mhisp |
          0  |          0  (empty)
          1  |   38.93988
             |
       fhisp |
          0  |          0  (empty)
          1  |          0
             |
     foreign |
          0  |          0  (empty)
          1  |  -72.23538
             |
     alcohol |
          0  |          0  (empty)
          1  |   -49.0195
             |
      msmoke |
    0 daily  |          0  (empty)
  1–5 daily  |  -144.4353
 6–10 daily  |  -206.2044
  11+ daily  |  -247.3819
             |
       fbaby |
         No  |          0  (empty)
        Yes  |  -50.38466
             |
   prenatal1 |
         No  |          0  (empty)
        Yes  |          0
             |
       _cons |     3256.7
------------------------------------------------------------------------------
------------------------------------------------------------------------------
     bweight | Coefficient
-------------+----------------------------------------------------------------
        mage |          0
             |
      c.mage#|
      c.mage |          0
             |
        fage |          0
             |
      c.fage#|
      c.fage |          0
             |
      c.mage#|
      c.fage |          0
             |
        fedu |          0
        medu |   .5584781
             |
      c.fedu#|
      c.medu |   .3520153
             |
    mmarried |
Not married  |          0  (empty)
    Married  |   151.3538
             |
       mhisp |
          0  |          0  (empty)
          1  |   38.93988
             |
       fhisp |
          0  |          0  (empty)
          1  |          0
             |
     foreign |
          0  |          0  (empty)
          1  |  -72.23538
             |
     alcohol |
          0  |          0  (empty)
          1  |   -49.0195
             |
      msmoke |
    0 daily  |          0  (empty)
  1–5 daily  |  -144.4353
 6–10 daily  |  -206.2044
  11+ daily  |  -247.3819
             |
       fbaby |
         No  |          0  (empty)
        Yes  |  -50.38466
             |
   prenatal1 |
         No  |          0  (empty)
        Yes  |          0
             |
       _cons |     3256.7
------------------------------------------------------------------------------