Instrumental Variables and 2SLS

Time to save A4 (hopefully)

Fernando Rios-Avila

The problem

The problem: Endogeneity

  • As I mentioned at the beginning, one of the most important assumptions required to analyze data and obtain correct estimations and draw inference was A4: No endogeneity or \(E(e|X)=0\)
    • Endogeneity is a problem that occurs because the error is related to \(X\).
    • This is a proble,, because we can no longer assume the error is, in average, constant when analyzing changes in \(X's\)

  • Why did it happen?
    • Usually because important variables are omitted
      • Add them back, or at least proxies?
    • Incorrect functional form
      • Try making it more flexible?
    • Data has measurement error
      • Get better data?
    • Sample is endogenous (other treatments are necessary)
    • Reverse causality (you dont know which cause which)
    • Simultenaity, similar to omitted variables. There is another factor that caused both the outcome and explanatory variable

A pair of Solutions

  • Today we will cover one approach that could help with many (not all) the situations that could cause endogeneity.
  • To apply this approach, however, we need:
    • More data (more variables with specific properties)
    • More information on how the “system” works.
  • These methods are:
    • IV - Instrumental variable
    • 2sls - Two-stage Least squares

NOTE: These two methods are almost interchangable.

  • IV refers to cases with 1 endogenous variable and 1 “instrument”

  • 2sls refers to cases with 1+ endogenous variables and “instruments”

What is an “Instrumental Variable

  • I have mentioned a few times the word “instrument” But what are they really?

    • Instruments: the heros/variables that will “save us” of endogeneity.
  • They have at least 2 properties:

    1. Instruments should be exogenous to the model
    • Does not appear in the specification, thus \(Z\) has no DIRECT effect on the outcome \(y\).
      • Effect exists only through the endogenous variable.
    • Also that there is no correlation between the model error and \(Z\).
    1. The instrument is relevant and related to \(x\) (endogenous variable)
    • Preferably, you need a variable that is not only correlated with \(X\) but determines changes in \(X\).
    • We also need this effect to be monotonic!
  • In many instances we even want an instrument that is just as good as [conditionally] random.

How Instruments work: The math

The problem \(corr(x_1,e) \neq 0\): \[\begin{aligned} y &= \beta_0 + \beta_1 x_1 + e || \tilde w = w-\bar w \\ \tilde \beta_1 &=\frac{\sum \tilde x_1 \tilde y}{\sum \tilde x_1^2}= \frac{\sum \tilde x_1 (\beta_1 \tilde x_1 + e)}{\sum \tilde x_1^2} \\ & = \beta_1 + \frac{\sum \tilde x_1 e}{\sum \tilde x_1^2} \end{aligned} \]

How IV works \(corr(z_1,e) \neq 0\):

\[\begin{aligned} \hat \beta_1 &=\frac{\sum \tilde z_1 \tilde y}{\sum \tilde z_1 \tilde x_1}= \frac{\sum \tilde z_1 (\beta_1 \tilde x_1 + e)}{\sum \tilde z_1 \tilde x_1} \\ & = \beta_1 + \frac{\sum \tilde z_1 e}{\sum \tilde z_1 \tilde x_1} \end{aligned} \]

How Instruments work: The intuition

  • One way of thinking about how IV works is by realizing not ALL changes in \(X_1\) are endogenous. Some are due to \(e\), but some are due other factors.
    • we just can’t differentiate them
    • If we could use (in the regression), only exogenous changes, (or omit endogenous ones), we could estimate our models correctly.
  • What IV’s do is to identify Part of the exogenous component (the one related to \(Z\)), and use only THAT variation to identify coefficients.
    • This would do a reasonable work, as long as the instrument is relevant, and instrument exogenous.

Example

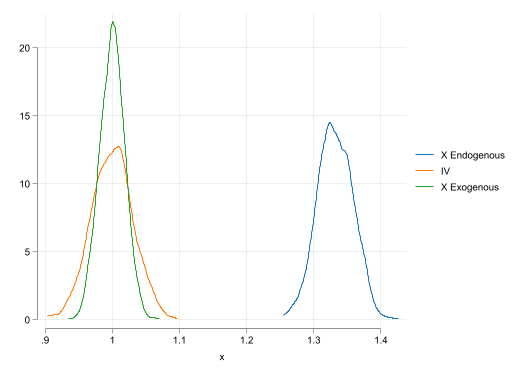
\[\begin{aligned} e &\sim chi(2)-2 ; z = chi(2)-2 ; x = chi(2)-2+z+e \\ y &=1+x+e \end{aligned} \]

Code
** Montecarlo Simulation
set linesize 255
clear
set seed 10101
set obs 1000
qui:mata:
k = 1000; n=1000
b1=bc = b = J(k,2,0)
for(i=1;i<=k;i++){
    e = rchi2(n,1,2):-2
    e1 = rchi2(n,1,2):-2
    z = rchi2(n,1,2):-2,J(n,1,1)
    x = rchi2(n,1,2):-2:+z[,1]:+e ,J(n,1,1)
    x1 = rchi2(n,1,2):-2:+z[,1]:+e1,J(n,1,1)
    y = 1:+x[,1]:+e
    y1 = 1:+x[,1]:+e1
    xx = cross(x,x)
    b[i,] = (invsym(xx)*cross(x,y))'
    bc[i,] = (invsym(cross(z,x))*cross(z,y))'
    b1[i,] = (invsym(xx)*cross(x,y1))'
}
end
getmata bb*=b
getmata bc*=bc
getmata b_*=b1
set scheme white2
color_style tableau
two kdensity bb1 ||  kdensity bc1  || kdensity b_1, ///
legend(order(1 "X Endogenous" 2 "IV" 3 "X Exogenous"))
SE and Statistical Inference

  • SE have a different structure compared to OLS.
  • In the simplest case (one dep variable that is endogenous), and under the assumption of Homoskedasticity, SE for \(\beta_1\) are given by:

\[\begin{aligned}Var_{iv}(\beta_1) = \frac{\hat\sigma^2_e}{SST_x R^2_{x|z}} \\ \hat\sigma^2_e =\frac{ \sum (y-\hat\beta_0-\hat\beta_1 x)^2}{n-2} \end{aligned} \]

  • Once they are obtained t-stats can be used as usual

Examples of IV’s

Education:

  • Fathers Education
  • Distance to School
  • # Siblins

Veteran Status:

  • Vietnam Lottery Ticket

Other:

  • Rain
  • Shift-Share
  • Judge FE
  • IV SE will be necessarily larger than OLS, because there is less variation of \(x\) used to identify \(\beta\).
  • If \(x\) is used as its own instrument, the estimator will be that of OLS.

Weak and Enogenous, and MLR

Weak and endogenous instruments:

  • While instruments can be used to address Endogeneity problems, finding good instruments can be hard.
    • They can be “weak-instruments”
    • or not fully exogenous
  • If this happens, IV can be worse than endogeneity:

\[\begin{aligned} plim \beta_{ols} &= \beta_1 + corr(x,u) \frac{\sigma_u}{\sigma_x} \\ plim \beta_{iv} &= \beta_1 + \frac{corr(z,u)}{corr(z,x)} \frac{\sigma_u}{\sigma_x} \end{aligned} \]

  • we will talk about the “weak-instruments” later today.

IV with MLR

Adding controls…is easy!

\[y = \beta_0 + \gamma_1 y_1 + X\beta + e ; z \text{ instrument for } y \]

We still assume 1 endogenous variable (\(y_1\)) and one instrument (\(z\))

\[X =\begin{bmatrix} 1 & y_1 & x_1 & x_2 & x_3 \end{bmatrix} ; Z =\begin{bmatrix} 1 & z & x_1 & x_2 & x_3 \end{bmatrix} \]

then \(\hat\beta_{iv}\) is given by

\[\hat\beta_{iv} = (Z'X)^{-1}{Z'y} \]

  • Same assumptions needed, except that instrument strength is measured by the \(corr(y_1-E[y_1|X], z-E[z|X] )\)
    • Multicollinearity problem can be a problem here

IV and Treatment Effects

One small note:

  • When analyzing the model of interest, we could also try to analyze the reduced form model:

\[y = \beta_0 + \lambda z + X \beta + e\]

  • This model will not give you the effect of \(y_1\) (endogenous variable), but can be just as interesting, specially when instrument and endogenous variables are dummies.

    • In such case \(\lambda\) will represent the “intention-to-treat” effect, rather than “treatment” effect.

2SLS: Many Ys many Zs

  • There could be situations where you have not one, but many instruments.
    • This may be rare, as even finding a single instrument can be hard
  • You may also have the situation where there is more than one endogenous variable!
    • In such case, you need at least as many IVs as endogenous variables
  1. The same assumptions as before apply. IV’s need to be exogenous, but relevant to explain the endogenous variables.

  2. Contrary to intuition, ALL instruments are used to analyze ALL exogenous variables

2SLS: Estimation

Consider the following:

  • \(y\) is the variable of interest
  • \(x1, x2\) set of exogenous variables
  • \(y1, y2\) set of endogenous variables
  • \(z1,z2,z3\) set of instruments for \(y1\) and \(y2\)

\(X's\) and \(Z's\) are exogenous:

Model of interesed: \[y = a_0 + a_1 y_1 + a_2 y_2 + b_1 x_1 + b_2 x_2 + b_3 x_3 + e \]

First Stage

\[\begin{aligned} y_1 = \gamma^1_0 + \gamma^1_1 z_1+ \gamma^1_2 z_2+ \gamma^1_3 z_3+\lambda^1_1 x_1 + \lambda^1_2 x_2 + \lambda^1_3 x_3 + v_1 \rightarrow \hat y_1 \\ y_2 = \gamma^2_0 + \gamma^2_1 z_1+ \gamma^2_2 z_2+ \gamma^2_3 z_3+\lambda^2_1 x_1 + \lambda^2_2 x_2 + \lambda^2_3 x_3 + v_2 \rightarrow \hat y_1 \end{aligned} \]

Second Stage:

\[y = a_0 + a_1 \hat y_1 + a_2 \hat y_2 + b_1 x_1 + b_2 x_2 + b_3 x_3 + e \]

This last model should work, because \(\hat y_1\) and \(\hat y_2\) are exogenous (if \(Zs\) are).

Standard Errors, however, need to be adjusted appropietly. (all two-step estimators need this)

Matrix Math

\[\begin{aligned} X &= \begin{bmatrix} 1 & y_k & x \end{bmatrix} \\ Z &=\begin{bmatrix} 1 & z & x \end{bmatrix} \end{aligned} \]

Then

\[\begin{aligned} \beta_{2sls} &= [X'Z(Z'Z)^{-1}Z'X]^{-1}[X'Z(Z'Z)^{-1}Z'y] \\ \beta_{2sls} &= [X'P_z X]^{-1}[X'P_z y] \\ \beta_{2sls} &= [\hat X'X]^{-1}[\hat X'y] \end{aligned} \]

Multicolinearity and 2sls

  • When Appplying 2sls, the problem of Multicolinearity could be stronger.
    • Because of MCL, Standard errors will increase (less individual variation.)
    • Because of IV, only a fraction of the variation is used for the analysis.
    • Botton line: Combined have conisderate results.

Weak Instruments

  • Weak Instruments create problems when using IV’s and 2SLS.
    • A weak instrument is one that doesnt have much explanatory power on dep variable, once all other controls are taken into account.
    • If the instrument is too weak, the bias it generates could larger than OLS.
    • The distribution of coefficent is no longer normal, so its harder to make inference.

How do we test for it?

We usually test for weak instruments when analyzing the “first-stage” regression.

\[y_2 = \gamma_0 + \gamma_1 z_1 + \gamma_2 z_2 + \gamma_3 x_1 + \gamma_4 x_2 + e \]

  • The null is: \(H_0: \gamma_1 = \gamma_2 =0\), or the instruments are weak.

  • Based on Stock and Yogo (2005), the general recommendation is to get an F>10, to reject the Null.

  • However, new evidence and research suggest that F=10 is not large enough.

    • One should either use F>104 (To keep the same t) (Lee McCrary Moreira Porter, 2020)
    • or use an alternative t-critica (3.4 for an F=10)

Examples

Code
/*
* This code is only to show the process. Too long to run in quarto
capture program drop simx 
program simx, eclass
clear
local N `1'
local F `2'
local sig = sqrt(`N'/ `F')
set obs `N'
gen e = rnormal()
gen z = rnormal() 
gen x = 1 + z + (e+rnormal())*sqrt(.5)*`sig'
*sqrt(10) 
gen y = 1 + (e+rnormal())*sqrt(.5)
reg x z, 
matrix b=(_b[z]/_se[z])^2
ivreg y (x=z), 
matrix b=b,_b[x],_b[x]/_se[x]
ereturn post b
end

tempfile f1 f2 f3 f4 f5
parallel initialize 14
parallel sim, reps(5000): simx 500 10
gen F=10
save `f1'
parallel sim, reps(5000): simx 500 20
gen F=20
save `f2'
parallel sim, reps(5000): simx 500 40
gen F=40
save `f3'
parallel sim, reps(5000): simx 500 80
gen F=80
save `f4'
parallel sim, reps(5000): simx 500 160
gen F=160
save `f5'

clear 
append using `f1'
append using `f2'
append using `f3'
append using `f4'
append using `f5'

ren (*) (f_stat b_coef t_stat)
*/
use mdata/ivweak, clear
set scheme white2
color_style tableau

joy_plot t_stat, over(F) xline(-1.96 1.96) xtitle(t-Stat) dadj(2)

IV for Measurement errors: Two wrongs make one right

  • As described previously when independent variables have measurement errors (Classical), using the variable with errors will produced biased coefficients.
  • If you have multiple variables with Mesurement error, however, its possible to use IV to correct the problem.
    • This is done by using one variable as the instrument of the other.
  • FOr this strategy to work, we need the error to be classical. That is, Uncorrelated across each other, and unrelated to the model error.

Consider the following:

\[\begin{aligned} y &= \beta_0 + \beta_1 x_1 + e \\ \check x_1 &= x_1 + u_1 \\ \tilde x_1 &= x_1 + u_2 \\ \end{aligned} \]

  • If we use each model, independently, we will have biased coefficients
  • If we combined the, Biases will remain present (albeit lower)
  • If we use one as instrument of the other tho:

\[ \begin{aligned} \beta_{1,iv} &= \frac{cov(\check x_1, y)}{cov(\check x_1, \tilde x_1)} or \beta_{1,iv} = \frac{cov(\tilde x_1, y)}{cov(\check x_1, \tilde x_1)} \\ & = \frac{cov(x_1 + u_1, \beta_0 + \beta_1 x_1 + e)}{cov(x_1 + u_2, x_1 + u_1)} \\ & = \frac{\beta_1 cov(x_1,x_1) + cov(x_1, e) + \beta_1 cov(u_1, x_1) + cov(x_1,e)}{cov(x_1 , x_1 )} \\ & = \beta_1 \end{aligned} \]

Example

Code
clear
set obs 1000
gen x = rnormal()
gen y = 1 + x + rnormal() 
gen x1 = x + rnormal()
gen x2 = x + rnormal()
qui: regress y x
est sto m1
qui: regress y x1
est sto m2
qui: regress y x2
est sto m3
gen x1_x2 = (x1 + x2)/2
qui: regress y x1_x2
est sto m3b
qui:ivregress 2sls  y (x1=x2)
est sto m4
qui:ivregress 2sls  y (x2=x1)
est sto m5
esttab m1 m2 m3 m3b m4 m5, se
Number of observations (_N) was 0, now 1,000.

------------------------------------------------------------------------------------------------------------
                      (1)             (2)             (3)             (4)             (5)             (6)   
                        y               y               y               y               y               y   
------------------------------------------------------------------------------------------------------------
x                   1.006***                                                                                
                 (0.0320)                                                                                   

x1                                  0.520***                                        1.018***                
                                 (0.0277)                                        (0.0640)                   

x2                                                  0.502***                                        1.038***
                                                 (0.0277)                                        (0.0654)   

x1_x2                                                               0.682***                                
                                                                 (0.0301)                                   

_cons               1.010***        0.996***        0.988***        0.983***        0.974***        0.956***
                 (0.0313)        (0.0380)        (0.0384)        (0.0360)        (0.0438)        (0.0451)   
------------------------------------------------------------------------------------------------------------
N                    1000            1000            1000            1000            1000            1000   
------------------------------------------------------------------------------------------------------------
Standard errors in parentheses
* p<0.05, ** p<0.01, *** p<0.001

Endogenous IVs and Too many IVs

Testing for Endogeneity and Overidentifying restrictions

  • In general, Instrumental variables are a great tool to deal with A4 violations.
    • but, it can be hard to find the perfect IV, and you may still have problems if its Weak.
  • In that case, it may be useful to asnwer…Do you have an Endogeneity problem? (empirically rather than theoretically)

Test:

  1. Estimate first stage, and save predicted residuals \(\hat v\):

\[y_2 = \gamma_0 + \gamma_1 z_1 + \gamma_2 x_1 + \gamma_3 x_2 + v \]

You expect residuals to be endogenous

  1. Estimate main model “adding” the residuals first stage

\[y = \beta_0 + \beta_1 y_2 + \beta_2 x_1 + \beta_3 x_2 + \theta \hat v + e \]

Test for \(H_0: \theta=0\).

  • If the model was endogenous, Then \(\theta\) will be different from zero, and \(\beta's\) different from the case without controlling for it.

  • Otherwise, we reject presence of endogeneity.

  • This method has the added advantage:

  • For the simple and exactly identified case, 2sls and adding residuals provide the same solution, except for SE. (its called Control function approach)

overidentifying restrictions

  • Some times, you may have access to multiple potential instruments.

    • But what if this instruments give you different results?
    • If you expect/believe a single effect exists, then there may be a problem. (one of they may be endogenous)
  • So how do we test if the instruments are exogenous?

    • First you need more instruments than endogenous variables.

  • S1. Estimate Structural Equation \[y=\beta_0 + \gamma y_2 + \beta_1 x_1 + e | y_2 \sim z_1, z_2 \]

  • S2. Auxiliary equation \[ \hat e = \delta_0 + \delta_1 z_1 + \delta_2 z2 + \delta_3 x_1 + v \]

  • S3. Test for Overall Fitness. \(nR^2\sim \chi^2(q_{iv})\) with \(q_{iv} = \# over IVs\)

IV’s as LATES

NOTE

Important

When describing this test, I mentioned that one would be typically worried if observing multiple coefficients when using different IV’s.

However, IV’s can identify different effects, because different IV’s may affect different people differently.

\(Z1\) may affect, say, only men. \(z_2\) only women, \(z_3\) only highly educated, etc.

When analyzing IV’s will be important to undertand who would be affected by the instrument the most, because that may explain why effects vary.

Example

Ignoring Potential endogeneity

frause mroz, clear
drop if lwage==.
** But with Endogeneity
reg lwage educ exper expersq
(325 observations deleted)

      Source |       SS           df       MS      Number of obs   =       428
-------------+----------------------------------   F(3, 424)       =     26.29
       Model |  35.0222967         3  11.6740989   Prob > F        =    0.0000
    Residual |  188.305144       424  .444115906   R-squared       =    0.1568
-------------+----------------------------------   Adj R-squared   =    0.1509
       Total |  223.327441       427  .523015084   Root MSE        =    .66642

------------------------------------------------------------------------------
       lwage | Coefficient  Std. err.      t    P>|t|     [95% conf. interval]
-------------+----------------------------------------------------------------
        educ |   .1074896   .0141465     7.60   0.000     .0796837    .1352956
       exper |   .0415665   .0131752     3.15   0.002     .0156697    .0674633
     expersq |  -.0008112   .0003932    -2.06   0.040    -.0015841   -.0000382
       _cons |  -.5220406   .1986321    -2.63   0.009    -.9124667   -.1316144
------------------------------------------------------------------------------

First Stage for different IVs

qui: reg educ fatheduc exper expersq
predict r1 , res
test fatheduc
adde scalar fiv = r(F)
adde scalar pfiv = r(p)
est sto m1
qui: reg educ motheduc exper expersq
predict r2 , res
test motheduc
adde scalar fiv = r(F)
adde scalar pfiv = r(p)
est sto m2
qui: reg educ fatheduc motheduc exper expersq
predict r3 , res
test motheduc fatheduc
adde scalar fiv = r(F)
adde scalar pfiv = r(p)
est sto m3

esttab m1 m2 m3 , scalar(fiv pfiv) sfmt(%5.2f %5.3f) order(fatheduc motheduc exper expersq) se ///
star(* 0.1 ** 0.05 *** 0.01)

 ( 1)  fatheduc = 0

       F(  1,   424) =   87.74
            Prob > F =    0.0000

 ( 1)  motheduc = 0

       F(  1,   424) =   73.95
            Prob > F =    0.0000

 ( 1)  motheduc = 0
 ( 2)  fatheduc = 0

       F(  2,   423) =   55.40
            Prob > F =    0.0000

------------------------------------------------------------
                      (1)             (2)             (3)   
                     educ            educ            educ   
------------------------------------------------------------
fatheduc            0.271***                        0.190***
                 (0.0289)                        (0.0338)   

motheduc                            0.268***        0.158***
                                 (0.0311)        (0.0359)   

exper              0.0468          0.0489          0.0452   
                 (0.0411)        (0.0417)        (0.0403)   

expersq          -0.00115        -0.00128        -0.00101   
                (0.00123)       (0.00124)       (0.00120)   

_cons               9.887***        9.775***        9.103***
                  (0.396)         (0.424)         (0.427)   
------------------------------------------------------------
N                     428             428             428   
fiv                 87.74           73.95           55.40   
pfiv                0.000           0.000           0.000   
------------------------------------------------------------
Standard errors in parentheses
* p<0.1, ** p<0.05, *** p<0.01

Using parents education as instruments

* SMALL requests Df adjustment
qui:ivregress 2sls lwage (educ= fatheduc ) exper expersq, small
est sto m1
qui:ivregress 2sls lwage (educ= motheduc ) exper expersq, small
est sto m2
qui:ivregress 2sls lwage (educ= fatheduc motheduc) exper expersq, small
est sto m3
esttab m1 m2 m3 , se mtitle(IV:Father IV:Mother IV:Parents) ///
star(* 0.1 ** 0.05 *** 0.01)

------------------------------------------------------------
                      (1)             (2)             (3)   
                IV:Father       IV:Mother      IV:Parents   
------------------------------------------------------------
educ               0.0702**        0.0493          0.0614*  
                 (0.0344)        (0.0374)        (0.0314)   

exper              0.0437***       0.0449***       0.0442***
                 (0.0134)        (0.0136)        (0.0134)   

expersq         -0.000882**     -0.000922**     -0.000899** 
               (0.000401)      (0.000406)      (0.000402)   

_cons             -0.0611           0.198          0.0481   
                  (0.436)         (0.473)         (0.400)   
------------------------------------------------------------
N                     428             428             428   
------------------------------------------------------------
Standard errors in parentheses
* p<0.1, ** p<0.05, *** p<0.01

** Testing for endogeneity

* Instrumenting education
qui:reg  lwage educ  exper expersq r1
est sto m1
qui:reg  lwage educ  exper expersq r2
est sto m2
qui:reg  lwage educ  exper expersq r3
est sto m3

esttab m1 m2 m3 , se mtitle(IV:Father IV:Mother IV:Parents) ///
star(* 0.1 ** 0.05 *** 0.01)

*see -estat endogenous- after ivregress 2sls

------------------------------------------------------------
                      (1)             (2)             (3)   
                IV:Father       IV:Mother      IV:Parents   
------------------------------------------------------------
educ               0.0702**        0.0493          0.0614** 
                 (0.0341)        (0.0366)        (0.0310)   

exper              0.0437***       0.0449***       0.0442***
                 (0.0133)        (0.0133)        (0.0132)   

expersq         -0.000882**     -0.000922**     -0.000899** 
               (0.000397)      (0.000398)      (0.000396)   

r1                 0.0450                                   
                 (0.0375)                                   

r2                                 0.0684*                  
                                 (0.0397)                   

r3                                                 0.0582*  
                                                 (0.0348)   

_cons             -0.0611           0.198          0.0481   
                  (0.433)         (0.463)         (0.395)   
------------------------------------------------------------
N                     428             428             428   
------------------------------------------------------------
Standard errors in parentheses
* p<0.1, ** p<0.05, *** p<0.01

Overid Test

qui:ivregress 2sls lwage (educ= fatheduc motheduc) exper expersq, small
predict resid, res
estat overid 
reg resid fatheduc motheduc exper expersq, notable robust

  Tests of overidentifying restrictions:

  Sargan (score) chi2(1) =  .378071  (p = 0.5386)
  Basmann chi2(1)        =  .373985  (p = 0.5408)

Linear regression                               Number of obs     =        428
                                                F(4, 423)         =       0.11
                                                Prob > F          =     0.9791
                                                R-squared         =     0.0009
                                                Root MSE          =     .67521

Thats all for today!

Next week: Limited Dep Variables When data has kinks