Research Methods II

Analyzing Gaps

Fernando Rios-Avila

Introduction

What do we mean by decomposition?

  • In Economics, decomposition refers to the process breaking down an index or aggregate measure into factors that explain it.

  • We have done some of this last week with Decomposition by groups and sources.

  • But there are other types of decompositions that are useful in Economics.

\[ \begin{aligned} y &=A L^\alpha K ^\beta \\ \frac{\Delta y}{y} &=\frac{\Delta A}{A} + \alpha \frac{\Delta L}{L} + \beta \frac{\Delta K}{K} \end{aligned} \]

  • Today we will focus on a different kind of Decomposition: Decomposition of gaps.

Introduction to Oaxaca-Blinder Decomposition

  • The most common type of decomposition of gaps is the Oaxaca-Blinder Decomposition.

  • The idea behind is as follows:

    • There are two groups you are interested in comparing.
    • Group A has a higher average value of a variable of interest than Group B.
      • What explains the difference??
    • The Oaxaca-Blinder Decomposition allows you to answer this question.
      • The difference could be due to differences in the characteristics
      • Or it could be due to differences in the returns to those characteristics.

Introduction to Oaxaca-Blinder Decomposition

  • In 1973 Oaxaca and Blinder independently proposed a very similar method to decompose the differences in averages value of a variable of interest between two groups.

“Male-Female Wage Differentials in Urban Labor Markets” Oaxaca (IER 1973)

“Wage Discrimination: Reduced Form and Structural Estimates” Blinder (JHR 1973)

  • Which become the basis for what is known as the Oaxaca-Blinder Decomposition.
  • Heavily used in Labor Economics, it can be helpful to explain what factors relate to: Union premiums, povery gaps, gender wage gaps, etc.

Oaxaca-Blinder Decomposition

General Framework

  • Suppose we have two groups: \(A\) and \(B\), with Data generating processes (DGP) that are defined as:

\[\begin{aligned} Y_a = G_a(X_a,\epsilon_a) \\ Y_b = G_b(X_b,\epsilon_b) \\ \end{aligned} \]

  • Differences between two groups could be explain by:
    • Differences in observed characteristics \(X_a\) and \(X_b\)
    • Differences in unobserved \(\epsilon_a\) and \(\epsilon_b\)
    • Differences in the Funcional forms \(G_a\) and \(G_b\)
  • To some extent, this suggests something akin to a counterfactual.

Imposing Restrictions

To implement OB, we need to impose some restrictions on the model.

1st Functional form: Linear in parameters \[G_a(X_k,\epsilon_k) = X_k \beta_k + \epsilon_k \]

2nd Errors are independent by group: \[\varepsilon_i \perp D | X_i \]

This makes it possible to have other problems in the model (like endogeneity) and still get aggregate consistent estimates. (but lets assume Zero Conditional Mean )

3rd Homoskedastic (across groups)

4th We only care about Differences in means

OB In Action

  • Suppose the models are given by:

\[Y_k = X_k \beta_k + \epsilon_k \]

  • Then, the “average” outcome for each group is given by:

\[\bar Y_k =\bar X_k \beta_k \]

  • This is useful, because we could now use it for creating a counterfactual.
    • \(\bar X_a \beta_a\) is the average wage of group A
    • \(\bar X_b \beta_a\) is the average wage of group B if “paid like” group A.
      • or Average Wages of Group A if they had the characteristics of Group B.
  • With this, we can now obtain the OB Decomposition.

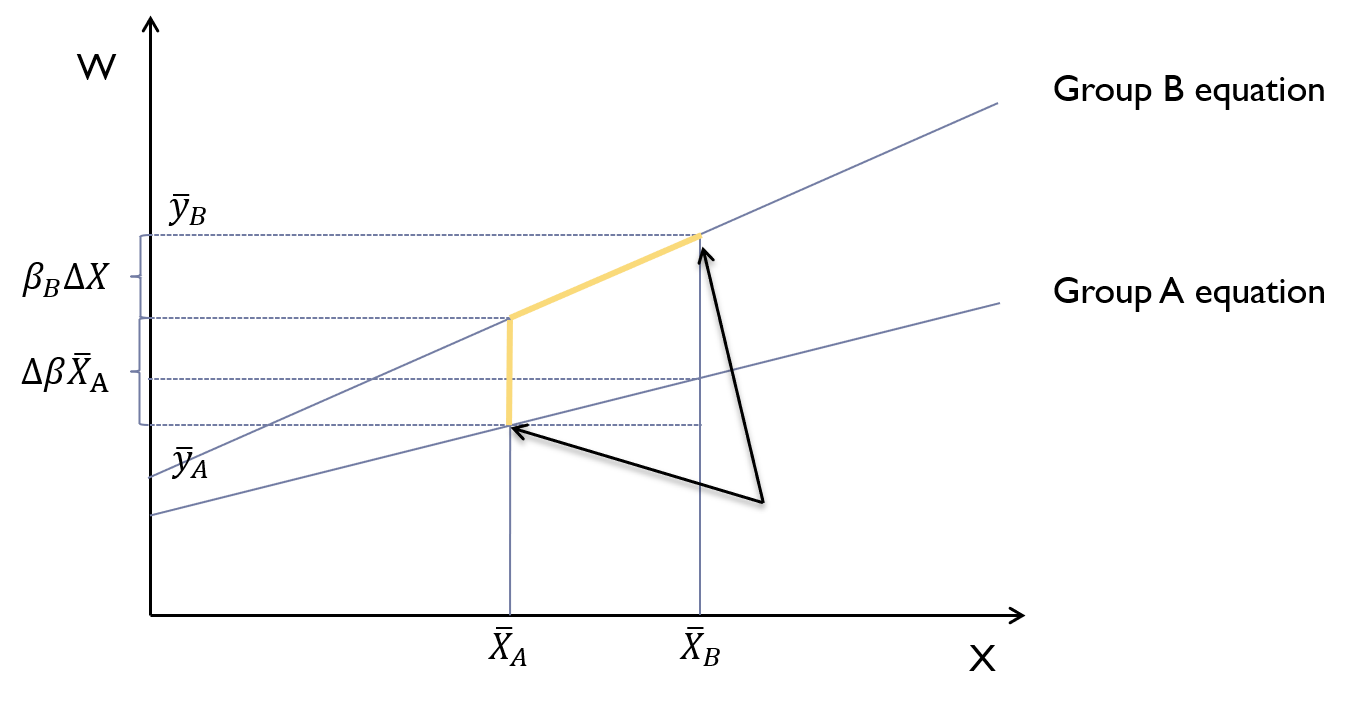
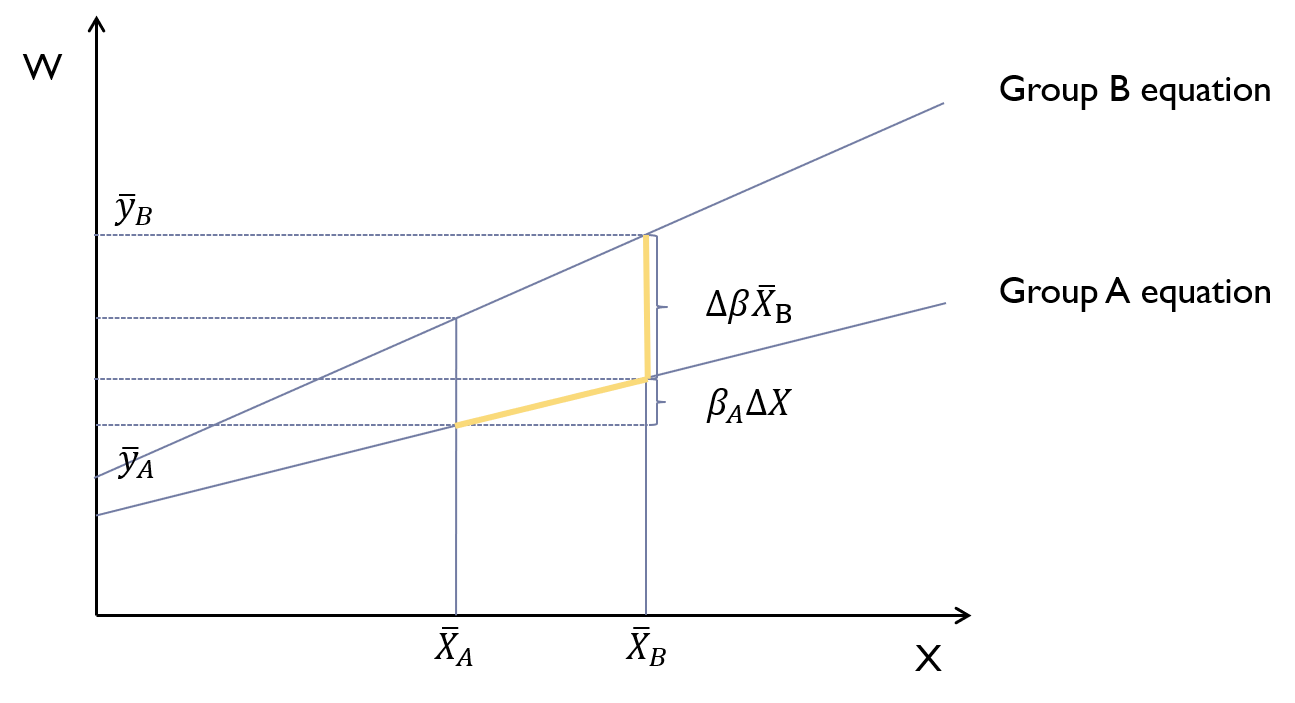
\[\begin{aligned} \Delta \bar Y &= \bar Y_a - \bar Y_b \\ &= \bar X_a \beta_a - \bar X_b \beta_b \\ \end{aligned} \]

  • Now we need a Counterfactual: What if Group A were paid as of Group B? \(\bar X_a \beta_b\)

\[\begin{aligned} \Delta \bar Y &= \bar Y_a - \bar Y_b + \bar Y^c_a - \bar Y^c_a\\ &= \color{blue}{\bar X_a \beta_a} - \color{red}{\bar X_b \beta_b + \bar X_a \beta_b} - \color{blue}{\bar X_a \beta_b} \\ &= \color{blue}{(\bar X_a \beta_a- \bar X_a \beta_b)} + \color{red}{ (\bar X_a \beta_b - \bar X_b \beta_b)} \\ &= \color{blue}{\bar X_a (\beta_a- \beta_b)} + \color{red}{ (\bar X_a - \bar X_b) \beta_b} \\ &= \color{blue}{\bar X_a \Delta \beta} + \color{red}{ \Delta \bar X \beta_b} \\ \end{aligned} \]

Thus Differences in averages is decomposed into two parts:

  • Diff in \(X's\) and (weighted by \(\beta_b\))
  • Diff in \(\beta's\). (weighted by \(\bar X_a\))

OB: From Aggregate to detailed

  • The previous decomposition is for Aggregates.
    • They are robust to endogeneity, (if endogeneity is the same across groups)
  • If the model is correctly specified, we can also decompose the differences in the detailed level.

\[\begin{aligned} \Delta X \beta_b &= \beta_{a0}-\beta_{b0} + \sum_{j=1}^k \bar X_{aj}(\beta_{aj} - \beta_{bj}) \\ \bar X_a \Delta \beta &= \sum_{j=1}^k (\bar X_{aj} - \bar X_{bj}) \beta_{bj} \end{aligned} \]

Note:

  • The decomposition is not unique.
    • Depends on the “counterfactual” we choose.
  • The decomposition is not causal, but may be indicative of potential causes.
  • The decomposition is not a test of discrimination.
    • As it does not assess why the differences in \(\beta\) exist, nor what explains the differences in \(\bar X\).

In a picture

  • Neither option is “correct” or “incorrect”.
  • They are just different ways of measuring the gaps.
  • However, you may want to consider which one is more appropriate for your research question.
  • Or consider other decomposition options
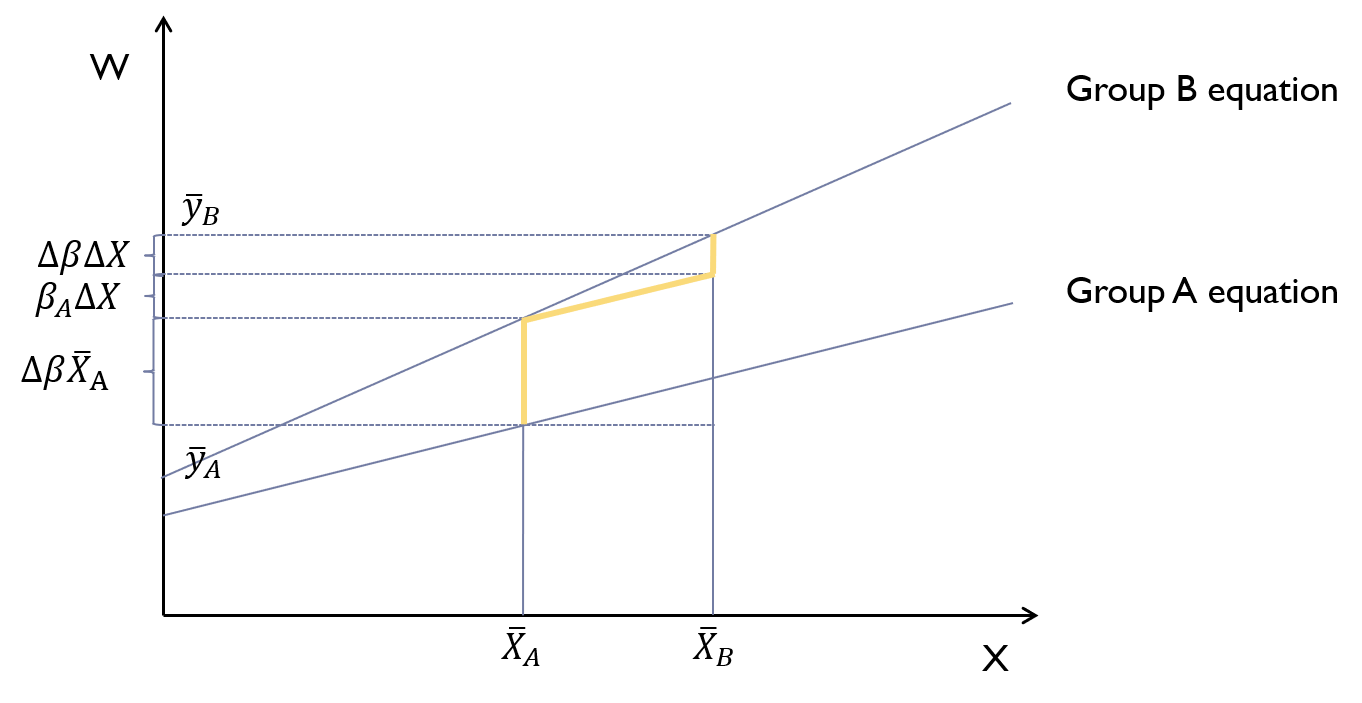
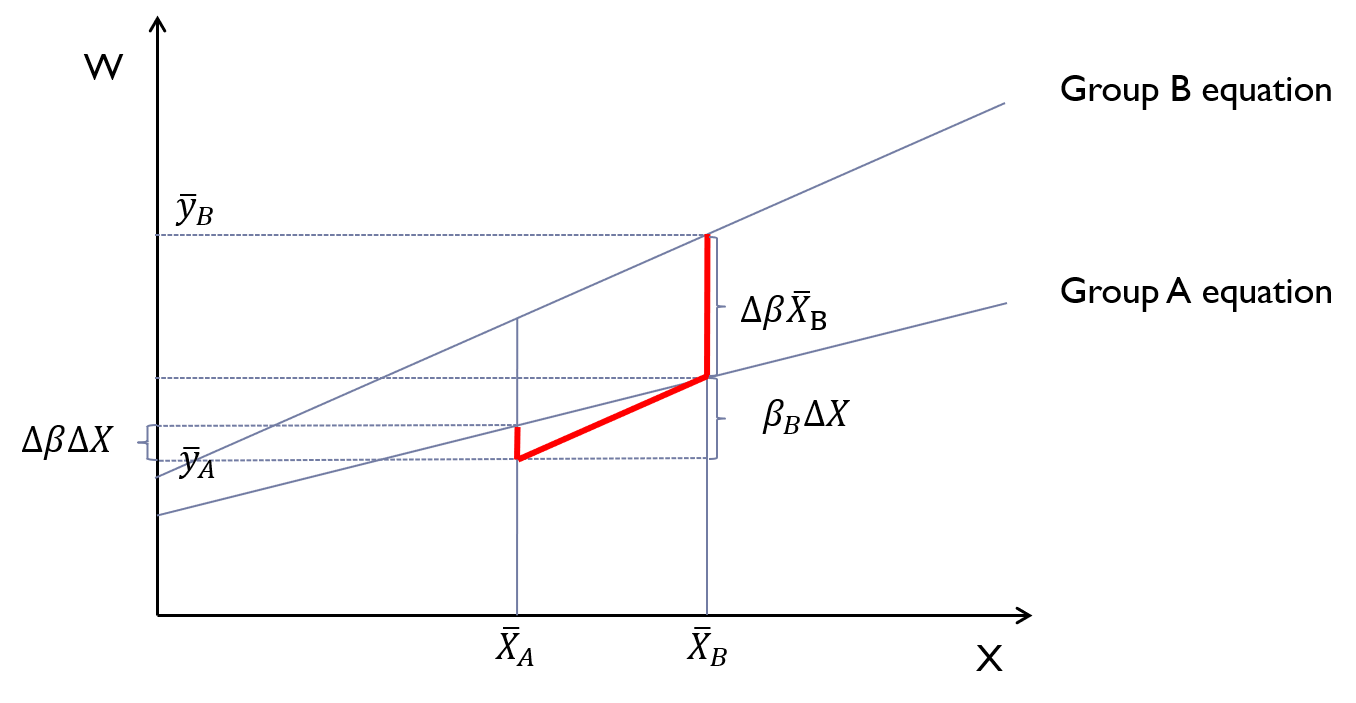
    • Single Ref group with 3-way Decomposition

3-way Decomposition

  • Mathematically:

\[\begin{aligned} \Delta \bar Y &= \bar Y_a - \bar Y_b \\ &= \bar X_a \beta_a - \bar X_b \beta_b \\ &= \bar X_a \Delta \beta + \Delta \bar X \beta_b + \Delta \bar X \beta_a - \Delta \bar X \beta_a \\ &= {\bar X_a \Delta \beta} + \Delta \bar X \beta_a - \Delta \bar X \Delta \beta \\ \text{ or } \\ &= \bar X_a \Delta \beta + \Delta \bar X \beta_b + \bar X_b \Delta \beta - \bar X_b \Delta \beta \\ &= \bar X_b \Delta \beta + \Delta \bar X \beta_b + \Delta X \Delta \beta \end{aligned} \]

Example:

Code
frause oaxaca, clear
drop if lnwage == .
(Excerpt from the Swiss Labor Market Survey 1998)
(213 observations deleted)

First things first:

  • Define your groups of interest: Men vs Women
  • Identify your model of interest: Simple Specification
  • And obtain Summary Statistics
Code
tabstat lnwage educ exper age married , by(female)

Summary statistics: Mean
Group variable: female (sex of respondent (1=female))

  female |    lnwage      educ     exper       age   married
---------+--------------------------------------------------
       0 |  3.440222  11.81425  14.07684  38.43142  .5219707
       1 |  3.266761  11.23206  12.13769  39.28697  .4128843
---------+--------------------------------------------------
   Total |  3.357604  11.53696  13.15324  38.83891  .4700139
------------------------------------------------------------
Code
gen cns = 1
qui:mean educ exper age married cns if female == 0
matrix x_men = e(b)
qui:mean educ exper age married cns if female == 1
matrix x_women = e(b)

Second, estimate models of interest

Code
qui: reg lnwage educ exper age married if female==0
est sto men
matrix b_men = e(b)
qui: reg lnwage educ exper age married if female==1
matrix b_women = e(b)
est sto women
esttab men women, nogaps se mtitle("Men" "Women")

--------------------------------------------
                      (1)             (2)   
                      Men           Women   
--------------------------------------------
educ               0.0540***       0.0853***
                (0.00595)       (0.00871)   
exper            -0.00495*        0.00776*  
                (0.00197)       (0.00346)   
age                0.0216***      0.00808** 
                (0.00202)       (0.00271)   
married             0.173***       -0.121** 
                 (0.0293)        (0.0421)   
_cons               1.950***        1.947***
                 (0.0757)         (0.124)   
--------------------------------------------
N                     751             683   
--------------------------------------------
Standard errors in parentheses
* p<0.05, ** p<0.01, *** p<0.001
Code
matrix DX = x_men - x_women 
matrix DB = b_men - b_women

matrix DX_bw = DX * b_women'
matrix Xm_Db = x_men * DB'

matrix DX_bm = DX * b_men'
matrix Xw_Db = x_women * DB'

matrix dDX_bw = vecdiag(DX' * b_women)'
matrix dXm_Db = vecdiag(x_men' * DB)'

matrix dDX_bm = vecdiag(DX' * b_men)'
matrix dXw_Db = vecdiag(x_women' * DB)'

** Total Gap Returns
matrix result = DX_bw + Xm_Db, DX_bw, Xm_Db, DX_bm, Xw_Db
matrix result =result\ dDX_bw + dXm_Db, dDX_bw, dXm_Db, dDX_bm, dXw_Db
matrix colname result = DY  DX_bw Xm_Db DX_bm  Xw_Db
matrix coleq result = "" op1 op1 op2 op2


matrix list result, format(%9.4f)

result[6,5]
                      op1:     op1:     op2:     op2:
              DY    DX_bw    Xm_Db    DX_bm    Xw_Db
     y1   0.1735   0.0446   0.1289   0.0222   0.1513
   educ  -0.3192   0.0496  -0.3689   0.0315  -0.3507
  exper  -0.1638   0.0150  -0.1789  -0.0096  -0.1542
    age   0.5141  -0.0069   0.5210  -0.0185   0.5326
married   0.1401  -0.0132   0.1533   0.0189   0.1213
  _cons   0.0023   0.0000   0.0023   0.0000   0.0023
  • Negative numbers “Contract” the gap,
  • Positive, “Expand” the gap.

The oaxaca way

Code
ssc install oaxaca
qui:oaxaca lnwage educ exper age married, by(female) w(0)  
est sto m1
qui:oaxaca lnwage educ exper age married, by(female) w(1)  
est sto m2
esttab m1 m2, wide mtitle(bw_Xm Xm_bw)
checking oaxaca consistency and verifying not already installed...
all files already exist and are up to date.

----------------------------------------------------------------------
                      (1)                          (2)                
                    bw_Xm                        Xm_bw                
----------------------------------------------------------------------
overall                                                               
group_1             3.440***     (196.70)        3.440***     (196.70)
group_2             3.267***     (149.41)        3.267***     (149.41)
difference          0.173***       (6.20)        0.173***       (6.20)
explained          0.0446*         (2.50)       0.0222          (1.28)
unexplained         0.129***       (4.63)        0.151***       (5.69)
----------------------------------------------------------------------
explained                                                             
educ               0.0496***       (4.15)       0.0315***       (4.09)
exper              0.0150          (1.92)     -0.00960*        (-2.08)
age              -0.00691         (-1.32)      -0.0185         (-1.46)
married           -0.0132*        (-2.36)       0.0189***       (3.40)
----------------------------------------------------------------------
unexplained                                                           
educ               -0.369**       (-2.96)       -0.351**       (-2.96)
exper              -0.179**       (-3.17)       -0.154**       (-3.18)
age                 0.521***       (4.00)        0.533***       (4.00)
married             0.153***       (5.62)        0.121***       (5.54)
_cons             0.00234          (0.02)      0.00234          (0.02)
----------------------------------------------------------------------
N                    1434                         1434                
----------------------------------------------------------------------
t statistics in parentheses
* p<0.05, ** p<0.01, *** p<0.001
Choosing the Counterfactual

  • What should be a good counterfactual?

    • The one that is most relevant to your research question.
    • The one that is most likely to be true.
    • The one that is not affected by discrimination.
  • While most of the time, decomposition results do not change much respect to the counterfactual, some times they do.

  • What to do?

Choosing the Counterfactual

  • Default counterfactual is to use predict wages for group A, using Wage structure of group B.

  • Some times it may make more sense choosing something in between:

\[\beta_c = \omega \beta_a + (1-\omega) \beta_b \]

This is the meaning of w() in Oaxaca

  • Some times, you may want to use \(\beta's\) from a pool model (omega option in Oaxaca)

OB Cheat Sheet

  • Stata Implementation: oaxaca by Jann (2008)
  • Types of Decompositions
    • Trifold Decomposition: oaxaca y x1 x2 x3 x4, by(group)
    • Standard Decompositions: oaxaca y x1 x2 x3 x4, by(group) w(0) [w(1) ]
    • Reimiers (1983) Decomposition: oaxaca y x1 x2 x3 x4, by(group) w(0.5)
    • Cotton(1983) Decomposition: oaxaca y x1 x2 x3 x4, by(group) w(#=Share)
    • Oaxaca Ransom (1988,1994) and Neumark (1988) Decomposition: oaxaca y x1 x2 x3 x4, by(group) omega
    • Cain (1986): oaxaca y x1 x2 x3 x4, by(group) pool

Beyond Microdata - a note

  • The principles of OB decomposition can also be applied to other types of data, including Macro Data.
  • Consider: Between 1990 and 2000 poverty rates fell from 20 to 10%.
  • What factors explain this change?
    • Composition changes (Populations with lower poverty rates grew faster)
    • Povery rates within groups (Poverty rates within groups fell)

\[\begin{aligned} P_t - P_s &= \sum_{j=1}^K w_{jt} P_{jt} - \sum_{j=1}^K w_{js} P_{js} \\ \Delta P &= \sum_{j=1}^K w_{jt} ( P_{jt} - P_{js}) + \sum_{j=1}^K (w_{jt}-w_{js}) P_{js} \end{aligned} \]

OB Decomposition: Extensions

OB Decomposition: Extensions

  • OB Decompositions have two drawbacks
    • Its meant to analyze differences in average differences
    • It uses differences in mean characteristics
    • Its based on a linear model (OLS)
    • Strong assumptions on error terms
  • There are various extensions (discussed in Firpo, Fortin, Lemieux (2010)) that can be used to address some of this limitations.

Linearity Assumption

  • Barsky at al (2002) and Dinardo Fortin and Limeux (1996)
  • A strong assumption behind OB is that the model is linear in parameters.
    • This is important because the decomposition assumes we can make good “extrapolations” of the model.
    • This is a problem of model misspecification. (what to do?)
  • One option is to improve model specification
    • Consider using quadratic terms, interactions, with CENTERED variables.
  • However if Detailed decomposition is not of interest, one could use Re-weighting to get Counterfactuals

Re-weighting

  • Considered a more general model: \(Y_k = G_k(X) + \epsilon_k\) and \(E(Y|X,k) = G_k(X)\)

  • The overall mean, in this case could be written as:

\[\begin{aligned} E_k(Y)&=\int y f_k(y) dy = \iint (g_k(x) + \epsilon) f_k(x,\epsilon) dx d\epsilon \\ &= \int g_k(x) f_k(x) dx \\ &= \bar Y_{g=k, X=k} \end{aligned} \]

  • Now lets define a counterfactual: \(\bar Y^c_{x=A, g=B} = \int g_B(x) f_A(x) dx\)

    • this is defined as the average outcome of group A if they face the market of group B.
  • Then, the nonlinear decomposition can be written as:

\[\begin{aligned} \Delta \bar Y &= \bar Y_{G=A, X=A} - \bar Y_{G=B, X=B} \\ &= \bar Y_{G=A, X=A} - \bar Y_{G=B, X=B} + \bar Y^c_{G=A, X=B} - \bar Y^c_{G=A, X=B} \\ &= \bar Y_{G=A, X=A} - \bar Y^c_{G=A, X=B} + \bar Y^c_{G=A, X=B} - \bar Y_{G=B, X=B} \\ &= \Delta X + \Delta G \end{aligned} \]

But how are the counterfactuals weights identified?

Then the counterfactual can be written as:

\[ \begin{aligned} \bar Y^c_{G=A, X=B} &= \int g_A(x) f_B(x) dx = \int g_A(x) \frac{f_B(x)}{f_A(x)} f_A(x) dx \\ &= \int g_A(x) \frac{1-P_A(X)}{P_A(X)} f_A(x) dx \\ &= \int g_A(x) \widehat{IPW}(X) f_A(x) dx \\ \end{aligned} \]

Example

Code
frause oaxaca, clear
drop if lnwage==.
qui:logit female c.(educ exper age married)##c.(educ exper age married), nolog
predict pr_b, pr

gen ipw1 = (1-pr_b)/pr_b if female==1
gen ipw2 = pr_b/(1-pr_b) if female==0
qui:{
mean lnwage educ exper age married if female==0
est sto m1
mean lnwage educ exper age married if female==0 [pw=ipw2] 
est sto m2a
mean lnwage educ exper age married if female==1 [pw=ipw1]
est sto m2b
mean lnwage educ exper age married if female==1
est sto m3
 
}
esttab m1 m2a m2b m3, nogaps se ///
mtitle(Men Men_as_w Wmen_as_m Women)
(Excerpt from the Swiss Labor Market Survey 1998)
(213 observations deleted)
(751 missing values generated)
(683 missing values generated)

----------------------------------------------------------------------------
                      (1)             (2)             (3)             (4)   
                      Men        Men_as_w       Wmen_as_m           Women   
----------------------------------------------------------------------------
lnwage              3.440***        3.475***        3.277***        3.267***
                 (0.0175)        (0.0247)        (0.0280)        (0.0218)   
educ                11.81***        11.35***        11.82***        11.23***
                 (0.0895)         (0.112)         (0.154)        (0.0900)   
exper               14.08***        12.26***        15.23***        12.14***
                  (0.408)         (0.432)         (1.621)         (0.319)   
age                 38.43***        39.46***        39.47***        39.29***
                  (0.413)         (0.725)         (1.160)         (0.411)   
married             0.522***        0.393***        0.523***        0.413***
                 (0.0182)        (0.0252)        (0.0408)        (0.0189)   
----------------------------------------------------------------------------
N                     751             751             683             683   
----------------------------------------------------------------------------
Standard errors in parentheses
* p<0.05, ** p<0.01, *** p<0.001
Decomposition:

(1,2,4): - \(DX\) = (1) vs (2)= 3.440-3.475=-0.035 - \(DB\) = (2) vs (4)= 3.475-3.267 =0.208 (1,3,4) - \(DX\) = (3) vs (4) = 3.277-3.267 = 0.010 - \(DB\) = (1) vs (3) = 3.440-3.277 = 0.163

Code
replace ipw1=1 if ipw1==.
replace ipw2=1 if ipw2==.
reg lnwage female [pw=ipw1] 
reg lnwage female [pw=ipw2] 
(751 real changes made)
(683 real changes made)
(sum of wgt is 1,553.12667637155)

Linear regression                               Number of obs     =      1,434
                                                F(1, 1432)        =      24.62
                                                Prob > F          =     0.0000
                                                R-squared         =     0.0249
                                                Root MSE          =     .51221

------------------------------------------------------------------------------
             |               Robust
      lnwage | Coefficient  std. err.      t    P>|t|     [95% conf. interval]
-------------+----------------------------------------------------------------
      female |  -.1635866   .0329659    -4.96   0.000    -.2282533   -.0989199
       _cons |   3.440222   .0174631   197.00   0.000     3.405966    3.474478
------------------------------------------------------------------------------
(sum of wgt is 1,349.95921823604)

Linear regression                               Number of obs     =      1,434
                                                F(1, 1432)        =      39.96
                                                Prob > F          =     0.0000
                                                R-squared         =     0.0380
                                                Root MSE          =     .52454

------------------------------------------------------------------------------
             |               Robust
      lnwage | Coefficient  std. err.      t    P>|t|     [95% conf. interval]
-------------+----------------------------------------------------------------
      female |   -.208271   .0329455    -6.32   0.000    -.2728976   -.1436444
       _cons |   3.475032   .0246922   140.73   0.000     3.426596    3.523469
------------------------------------------------------------------------------

Re-weighting and other functions

  • The first advantage of re-weighting is that it allows for non-linear relationships between X and y. (via IPW)

  • It also allows you to move away from focusing on differences in means. Any transformation of the outcome is now valid!

Code
gen wage = exp(lnwage)
rifhdreg wage female [pw=ipw1] , rif(gini) over(female)
rifhdreg wage female [pw=ipw2] , rif(gini) over(female)

Linear regression                               Number of obs     =      1,434
                                                F(1, 1432)        =       2.12
                                                Prob > F          =     0.1457
                                                R-squared         =     0.0027
                                                Root MSE          =     .24103

------------------------------------------------------------------------------
             |               Robust
        wage | Coefficient  std. err.      t    P>|t|     [95% conf. interval]
-------------+----------------------------------------------------------------
      female |   .0252941   .0173772     1.46   0.146    -.0087934    .0593816
       _cons |   .2207253   .0067667    32.62   0.000     .2074516     .233999
------------------------------------------------------------------------------
Distributional Statistic: gini
Sample Mean    RIF gini :  .23379

Linear regression                               Number of obs     =      1,434
                                                F(1, 1432)        =      11.79
                                                Prob > F          =     0.0006
                                                R-squared         =     0.0096
                                                Root MSE          =     .24693

------------------------------------------------------------------------------
             |               Robust
        wage | Coefficient  std. err.      t    P>|t|     [95% conf. interval]
-------------+----------------------------------------------------------------
      female |   .0485792   .0141476     3.43   0.001     .0208269    .0763315
       _cons |   .2187795   .0078984    27.70   0.000     .2032859    .2342732
------------------------------------------------------------------------------
Distributional Statistic: gini
Sample Mean    RIF gini :  .24336
  • Drawback: requires correction of SE, and accounting for RW error and Specification error
  • Doesn’t easily allow for detailed Decompositions.

Going Beyond the mean

  • One additional and useful extension of the OB Decomposition is to use it for analysis of statistics other than the mean.

  • This can be done by using the recentered influence function (RIF) (Firpo, Fortin, Lemieux (2009,2018))

  • The idea: Use RIFs of the statistic of interest to decompose instead as dependent variable.

  • OB can then be applied as usual

  • Consider Double Decomposition to avoid Reweighting errors

Example

frause oaxaca, clear
drop if lnwage==.
gen wage = exp(lnwage)
ssc install rif
qui:oaxaca_rif wage educ exper age married, by(female) rif(mean)
est sto m1
qui:oaxaca_rif wage educ exper age married, by(female) rif(gini)
est sto m2
qui:oaxaca_rif wage educ exper age married, by(female) rif(q(25))
est sto m3
qui:oaxaca_rif wage educ exper age married, by(female) rif(iqsr(40 90))
est sto m4
 
esttab m1 m2 m3 m4, se nogaps ///
mtitle(Mean Gini 25th iqsr_4010)
(Excerpt from the Swiss Labor Market Survey 1998)
(213 observations deleted)
checking rif consistency and verifying not already installed...
all files already exist and are up to date.

----------------------------------------------------------------------------
                      (1)             (2)             (3)             (4)   
                     Mean            Gini            25th       iqsr_4010   
----------------------------------------------------------------------------
overall                                                                     
group_1             34.34***        0.221***        25.36***        0.713***
                  (0.518)       (0.00678)         (0.484)        (0.0244)   
group_2             30.25***        0.267***        20.91***        0.942***
                  (0.682)        (0.0118)         (0.507)        (0.0635)   
difference          4.083***      -0.0466***        4.448***       -0.230***
                  (0.857)        (0.0136)         (0.701)        (0.0681)   
explained           0.455         -0.0238**         0.969**        -0.111** 
                  (0.516)       (0.00758)         (0.371)        (0.0403)   
unexplained         3.628***      -0.0228           3.479***       -0.119   
                  (0.878)        (0.0153)         (0.733)        (0.0782)   
----------------------------------------------------------------------------
explained                                                                   
educ                1.220***     -0.00539           0.943***      -0.0238   
                  (0.312)       (0.00319)         (0.239)        (0.0169)   
exper              0.0121         -0.0121*          0.313         -0.0560*  
                  (0.216)       (0.00509)         (0.183)        (0.0260)   
age                -0.283        -0.00297         -0.0508         -0.0154   
                  (0.207)       (0.00243)        (0.0659)        (0.0128)   
married            -0.494**      -0.00332          -0.236         -0.0154   
                  (0.189)       (0.00280)         (0.125)        (0.0150)   
----------------------------------------------------------------------------
unexplained                                                                 
educ               -5.229           0.107          -10.68**         0.528   
                  (3.910)        (0.0695)         (3.346)         (0.349)   
exper              -3.666*         0.0476          -2.788           0.317   
                  (1.774)        (0.0317)         (1.475)         (0.162)   
age                 14.13***       -0.130           13.76***       -0.745*  
                  (4.070)        (0.0721)         (3.532)         (0.358)   
married             4.804***     -0.00499           3.654***     -0.00311   
                  (0.856)        (0.0149)         (0.731)        (0.0747)   
_cons              -6.410         -0.0420          -0.469          -0.215   
                  (4.582)        (0.0817)         (3.850)         (0.416)   
----------------------------------------------------------------------------
N                                                                           
----------------------------------------------------------------------------
Standard errors in parentheses
* p<0.05, ** p<0.01, *** p<0.001

Thats all for today!

Next week Significance levels and Missing Data